> ## Documentation Index
> Fetch the complete documentation index at: https://docs.open-politics.org/llms.txt
> Use this file to discover all available pages before exploring further.

# Overview

> How HQ is organised and where to find what

We aim to provide few but powerful core concepts to allow for flexible data ingestion, analysis and management.
Foundation services like AI Models, a Geocoder or a Websearch tool can extend the functionality and allow for hybrid setups. From cloud to fully local on your own hardware.

<Note>Before you start: make sure your providers for the foundation services are properly installed and configured. See [App Setup](/pages/app/app-setup) for more information. </Note>

## Infospaces

Think of an infospace as a project workspace. Each one keeps your data separate from other projects and has its own database and vector index to help you find relevant content.

<Frame>
  ```mermaid theme={null}
  flowchart TB
      I[Infospace]
      I --> A[Assets]
      I --> S[Schemas]
      
  ```
</Frame>

<CardGroup cols={2}>
  <Card title="Assets" icon="file-lines" href="/pages/app/assets">
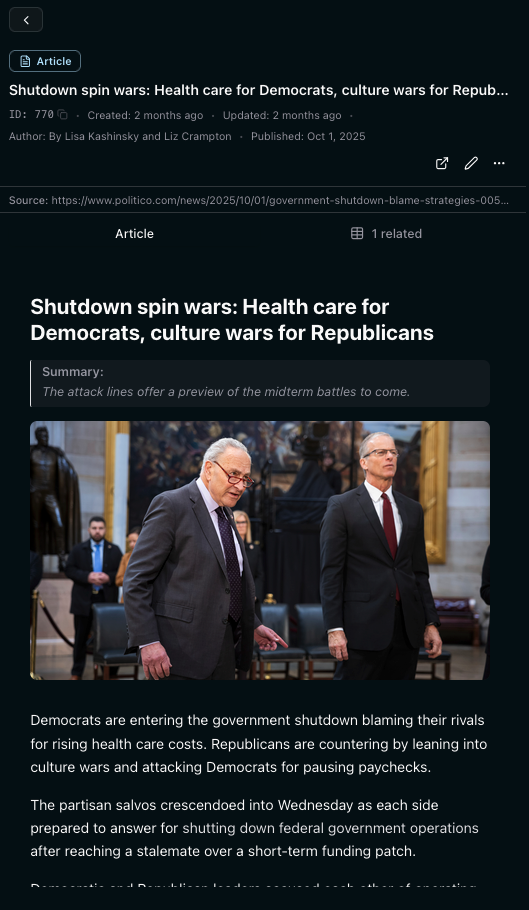
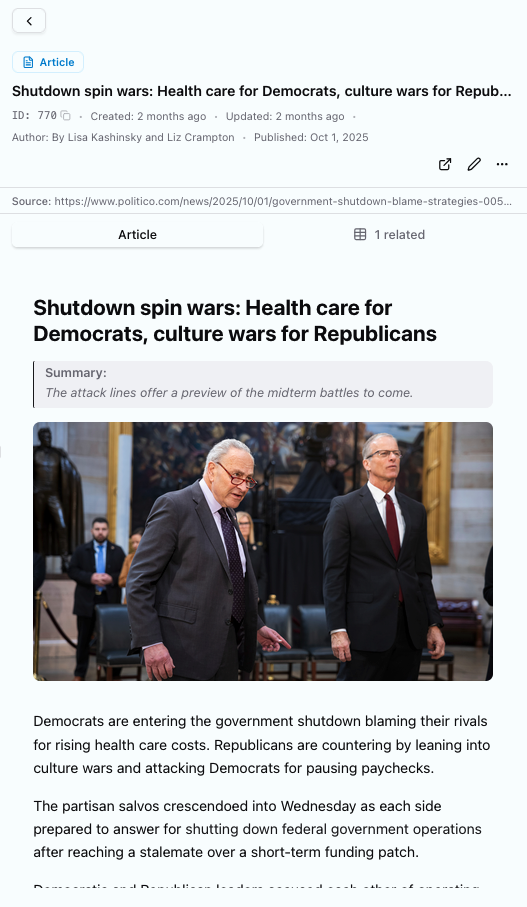
    Your data. PDFs, CSVs, articles, web feeds - anything you want to analyse. Composable: a document breaks into pages, a spreadsheet into rows. Bundles group assets for organisation and batch analysis.

    <img className="hidden dark:block" src="https://mintcdn.com/openpolitics/ROUsCWRLaAxCeMdD/images/asset-article-dark.png?fit=max&auto=format&n=ROUsCWRLaAxCeMdD&q=85&s=1ca1da761c3f0169606c141ed766892d" alt="Assets" width="100%" data-path="images/asset-article-dark.png" />

    <img className="block dark:hidden" src="https://mintcdn.com/openpolitics/ROUsCWRLaAxCeMdD/images/asset-article-light.png?fit=max&auto=format&n=ROUsCWRLaAxCeMdD&q=85&s=5e08644fd7ee482aaffd75855606bc39" alt="Assets" width="100%" data-path="images/asset-article-light.png" />
  </Card>

  <Card title="Schemas" icon="microscope" href="/pages/app/schemas">
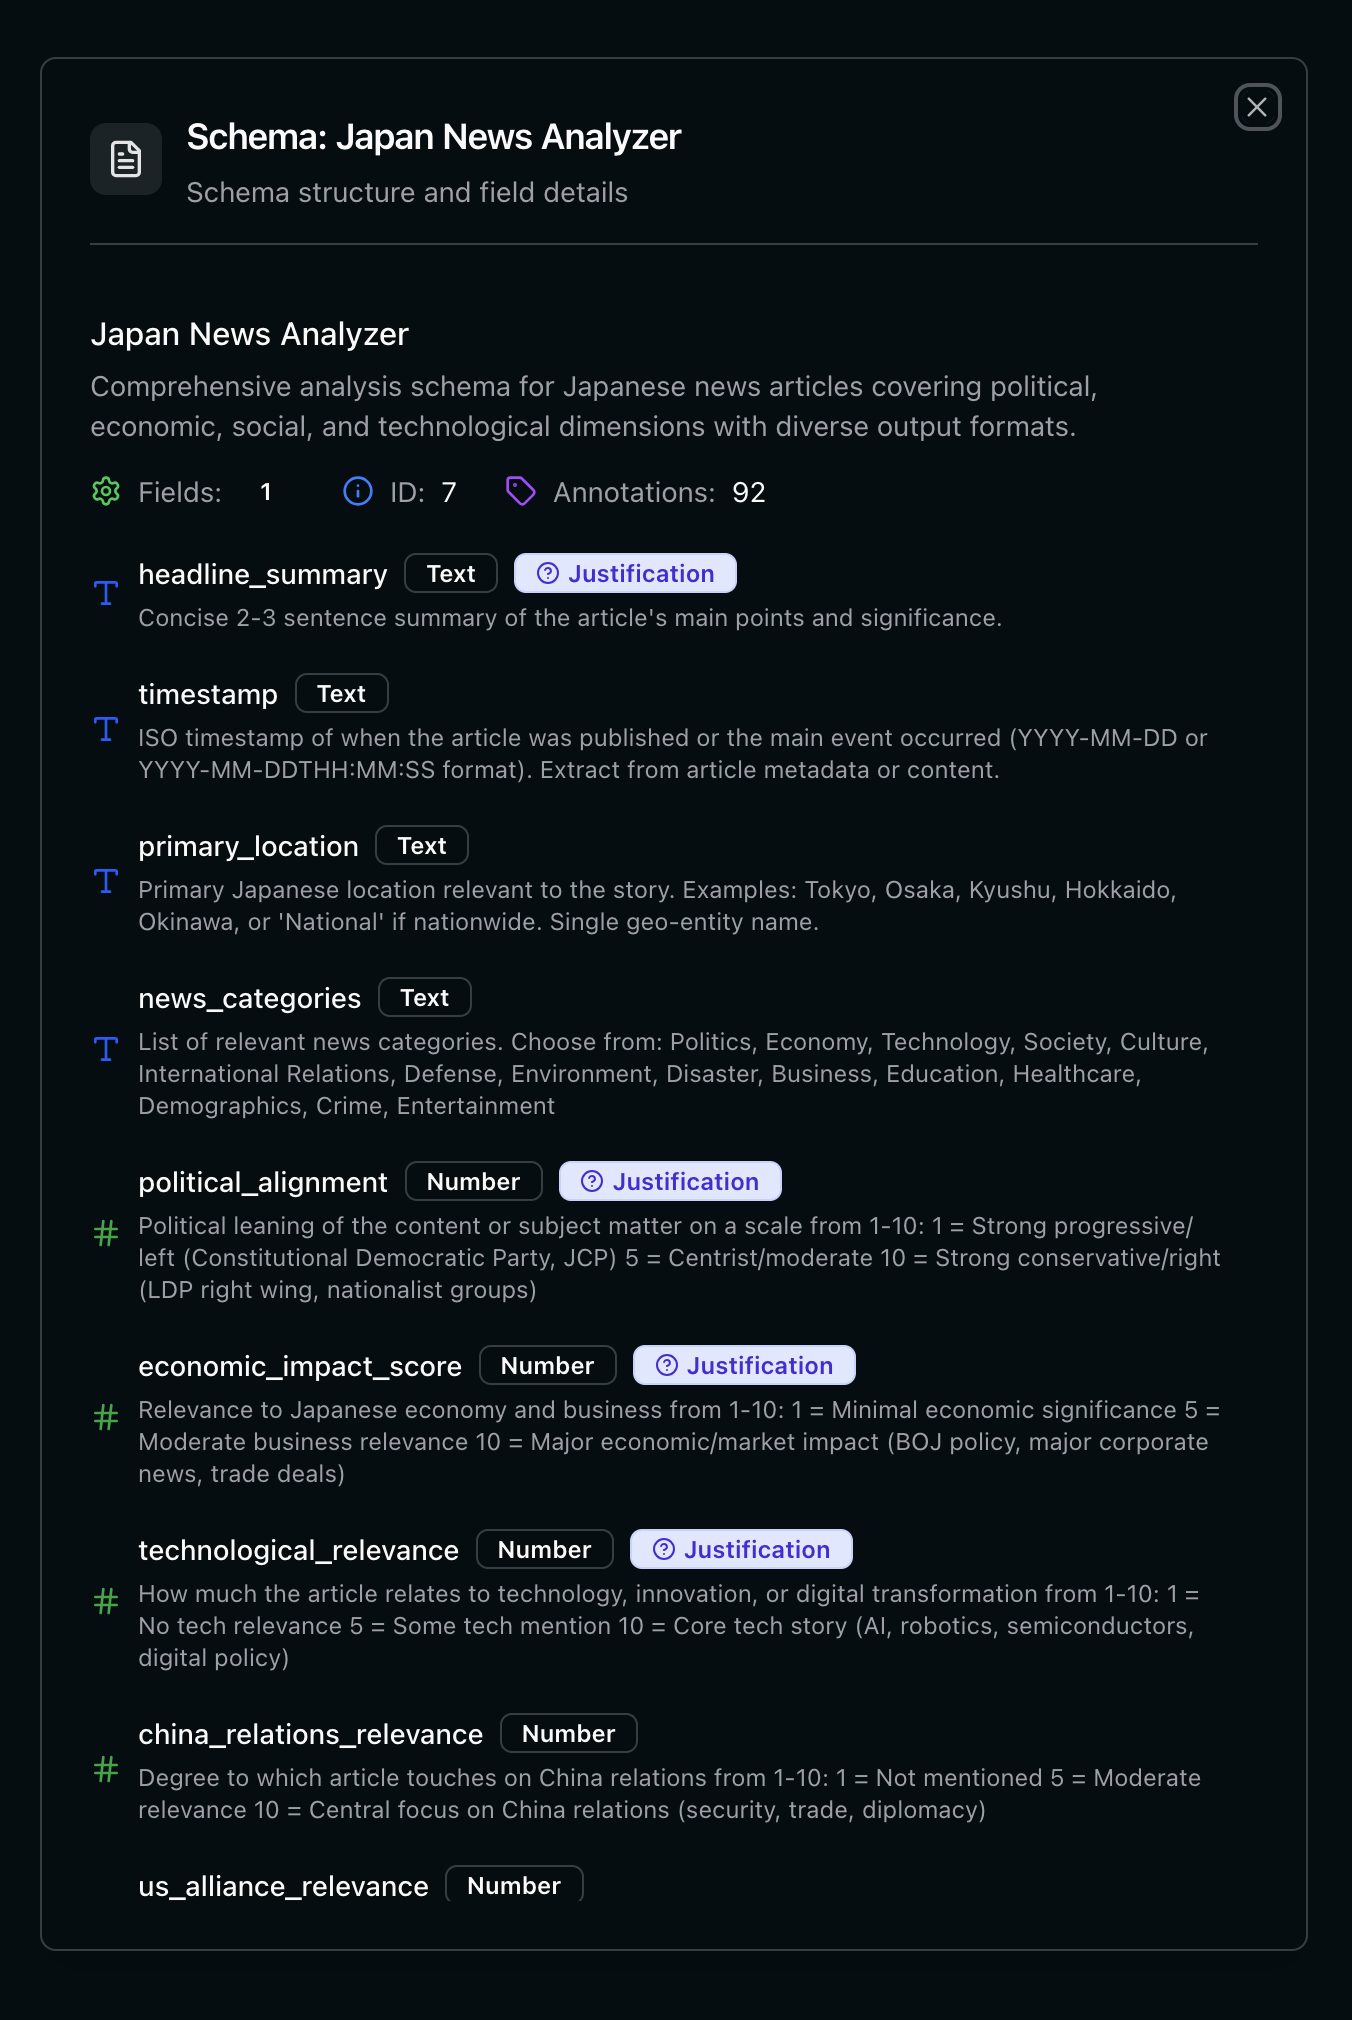
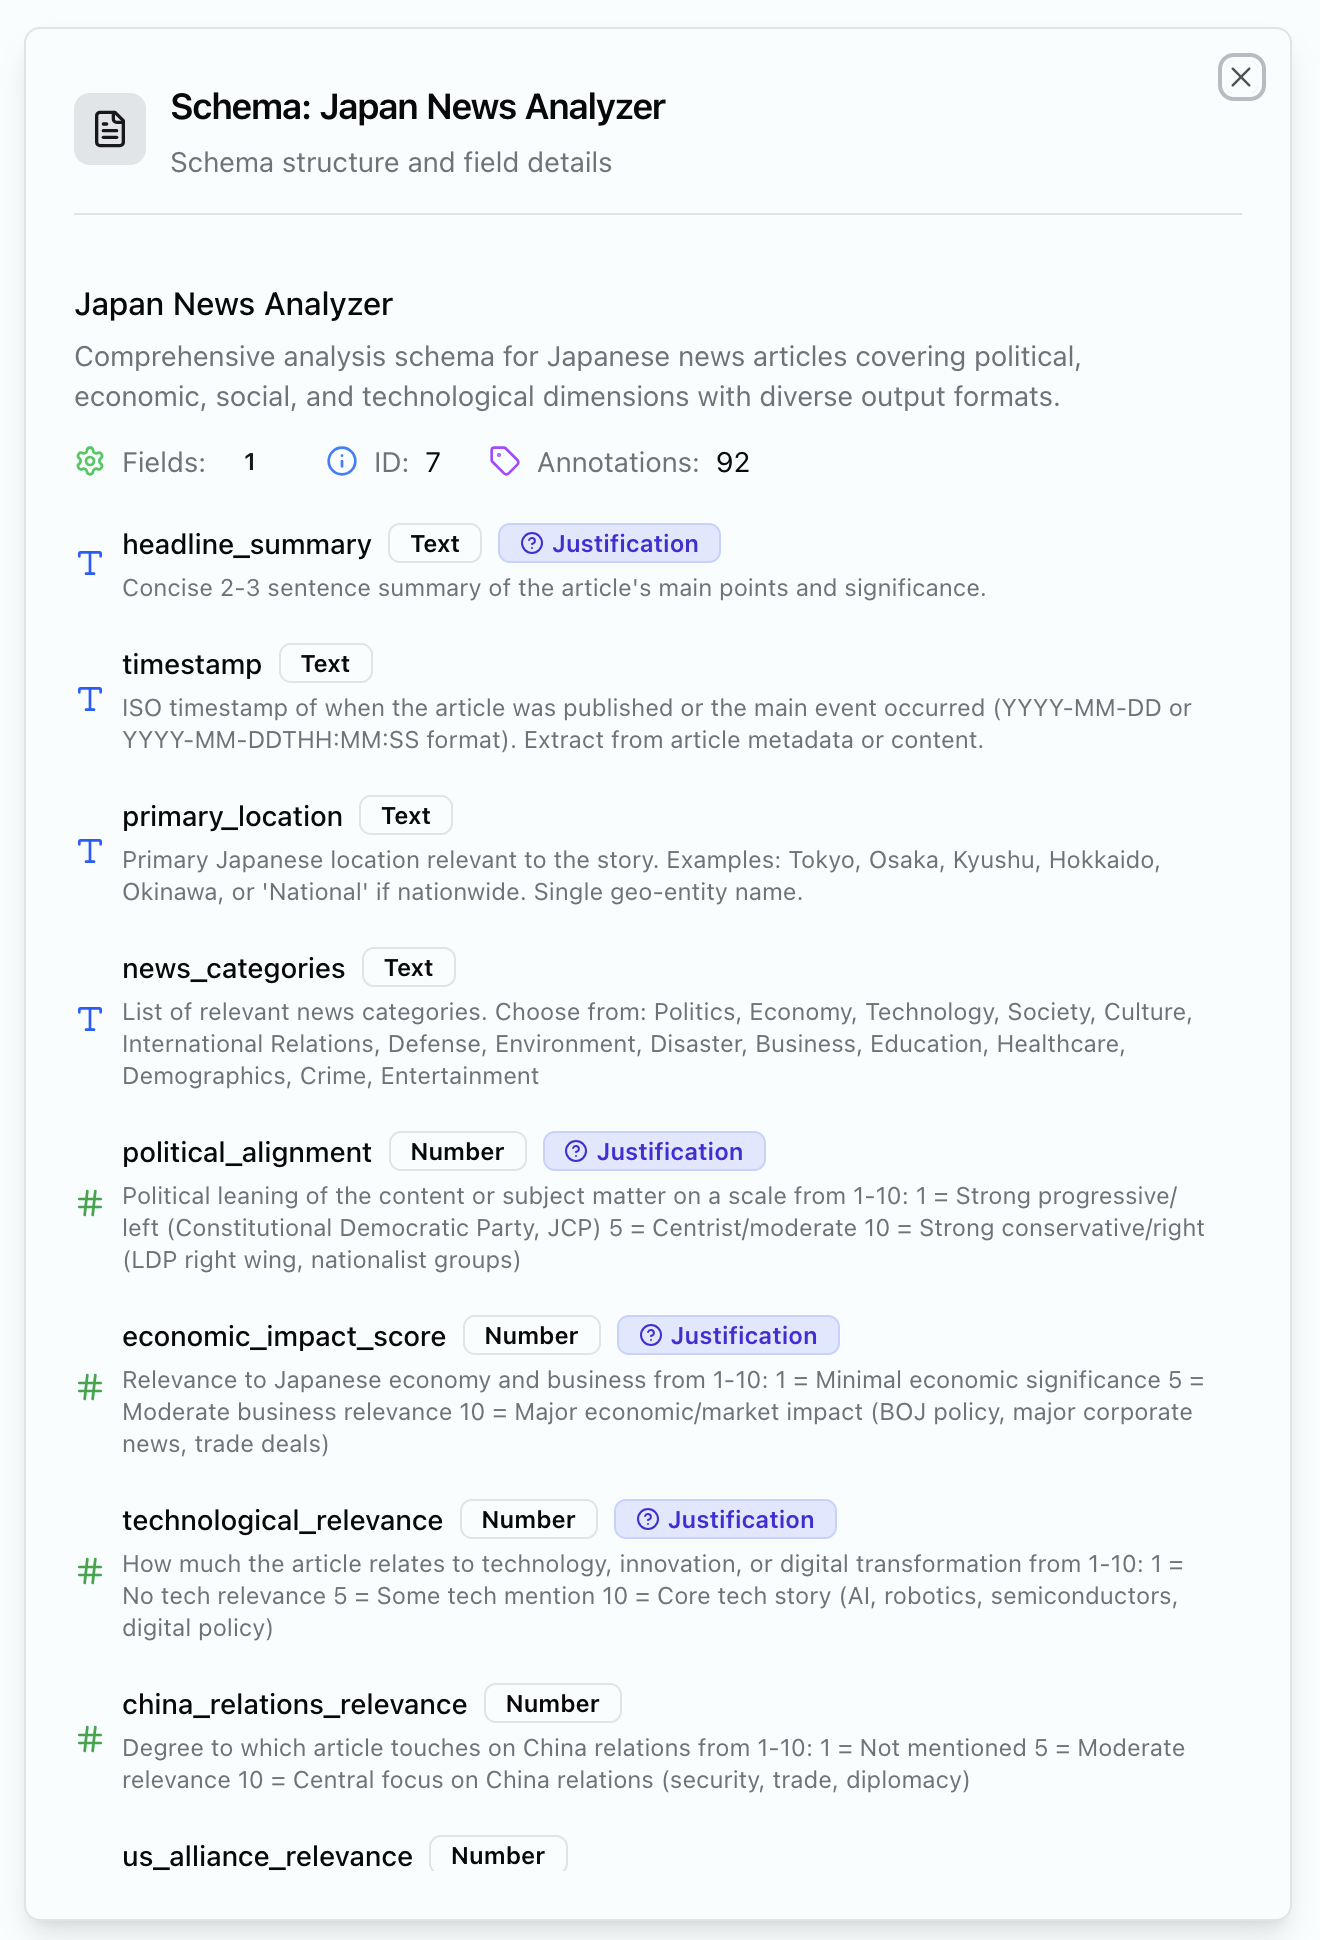
    Your lens and instructions for the AI. Natural language tasks with strict output definitions. Get structured, comparable data across all your documents.

    <img className="hidden dark:block" src="https://mintcdn.com/openpolitics/dbQgVi0ITAvSZFNw/images/schema-japan-dark.png?fit=max&auto=format&n=dbQgVi0ITAvSZFNw&q=85&s=0d9a0e0805911d437b853c22e5348462" alt="Schemas" width="100%" data-path="images/schema-japan-dark.png" />

    <img className="block dark:hidden" src="https://mintcdn.com/openpolitics/dbQgVi0ITAvSZFNw/images/schema-japan-light.png?fit=max&auto=format&n=dbQgVi0ITAvSZFNw&q=85&s=ad3c2facd4a0cdfd8e4413f5f4b0705b" alt="Schemas" width="100%" data-path="images/schema-japan-light.png" />
  </Card>
</CardGroup>

***

## Analysis

This is where it all comes together. With the building blocks above you are set to work through your data by configuring an analysis.

<Frame>
  ```mermaid theme={null}
  flowchart TB
      A[Assets] --> AN[Annotations]
      S[Schemas] --> AN
      AN --> D[Dashboards]
  ```
</Frame>

<CardGroup cols={2}>
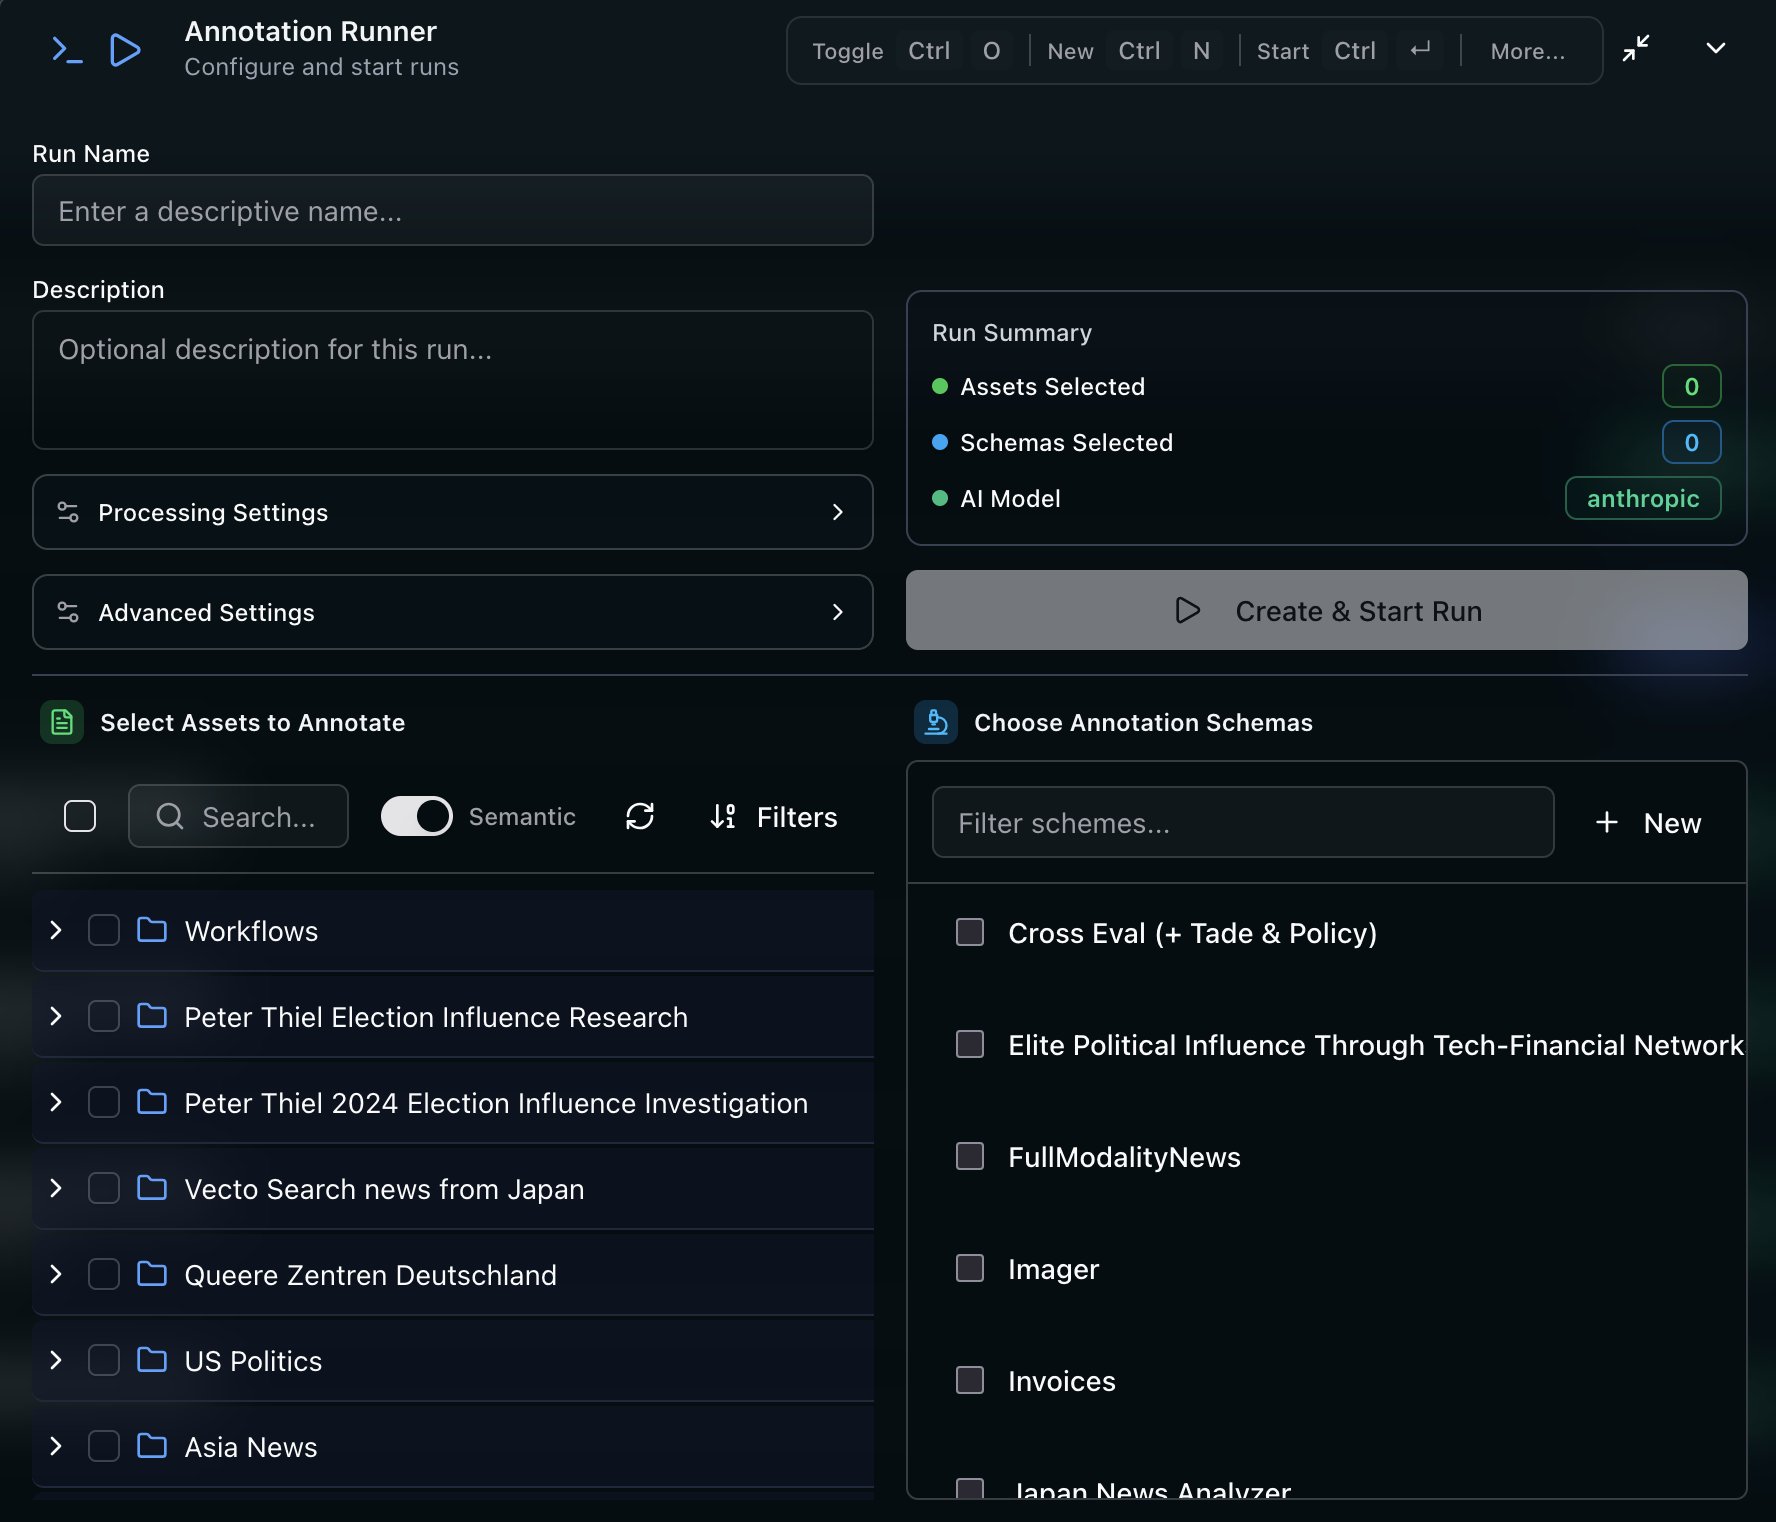
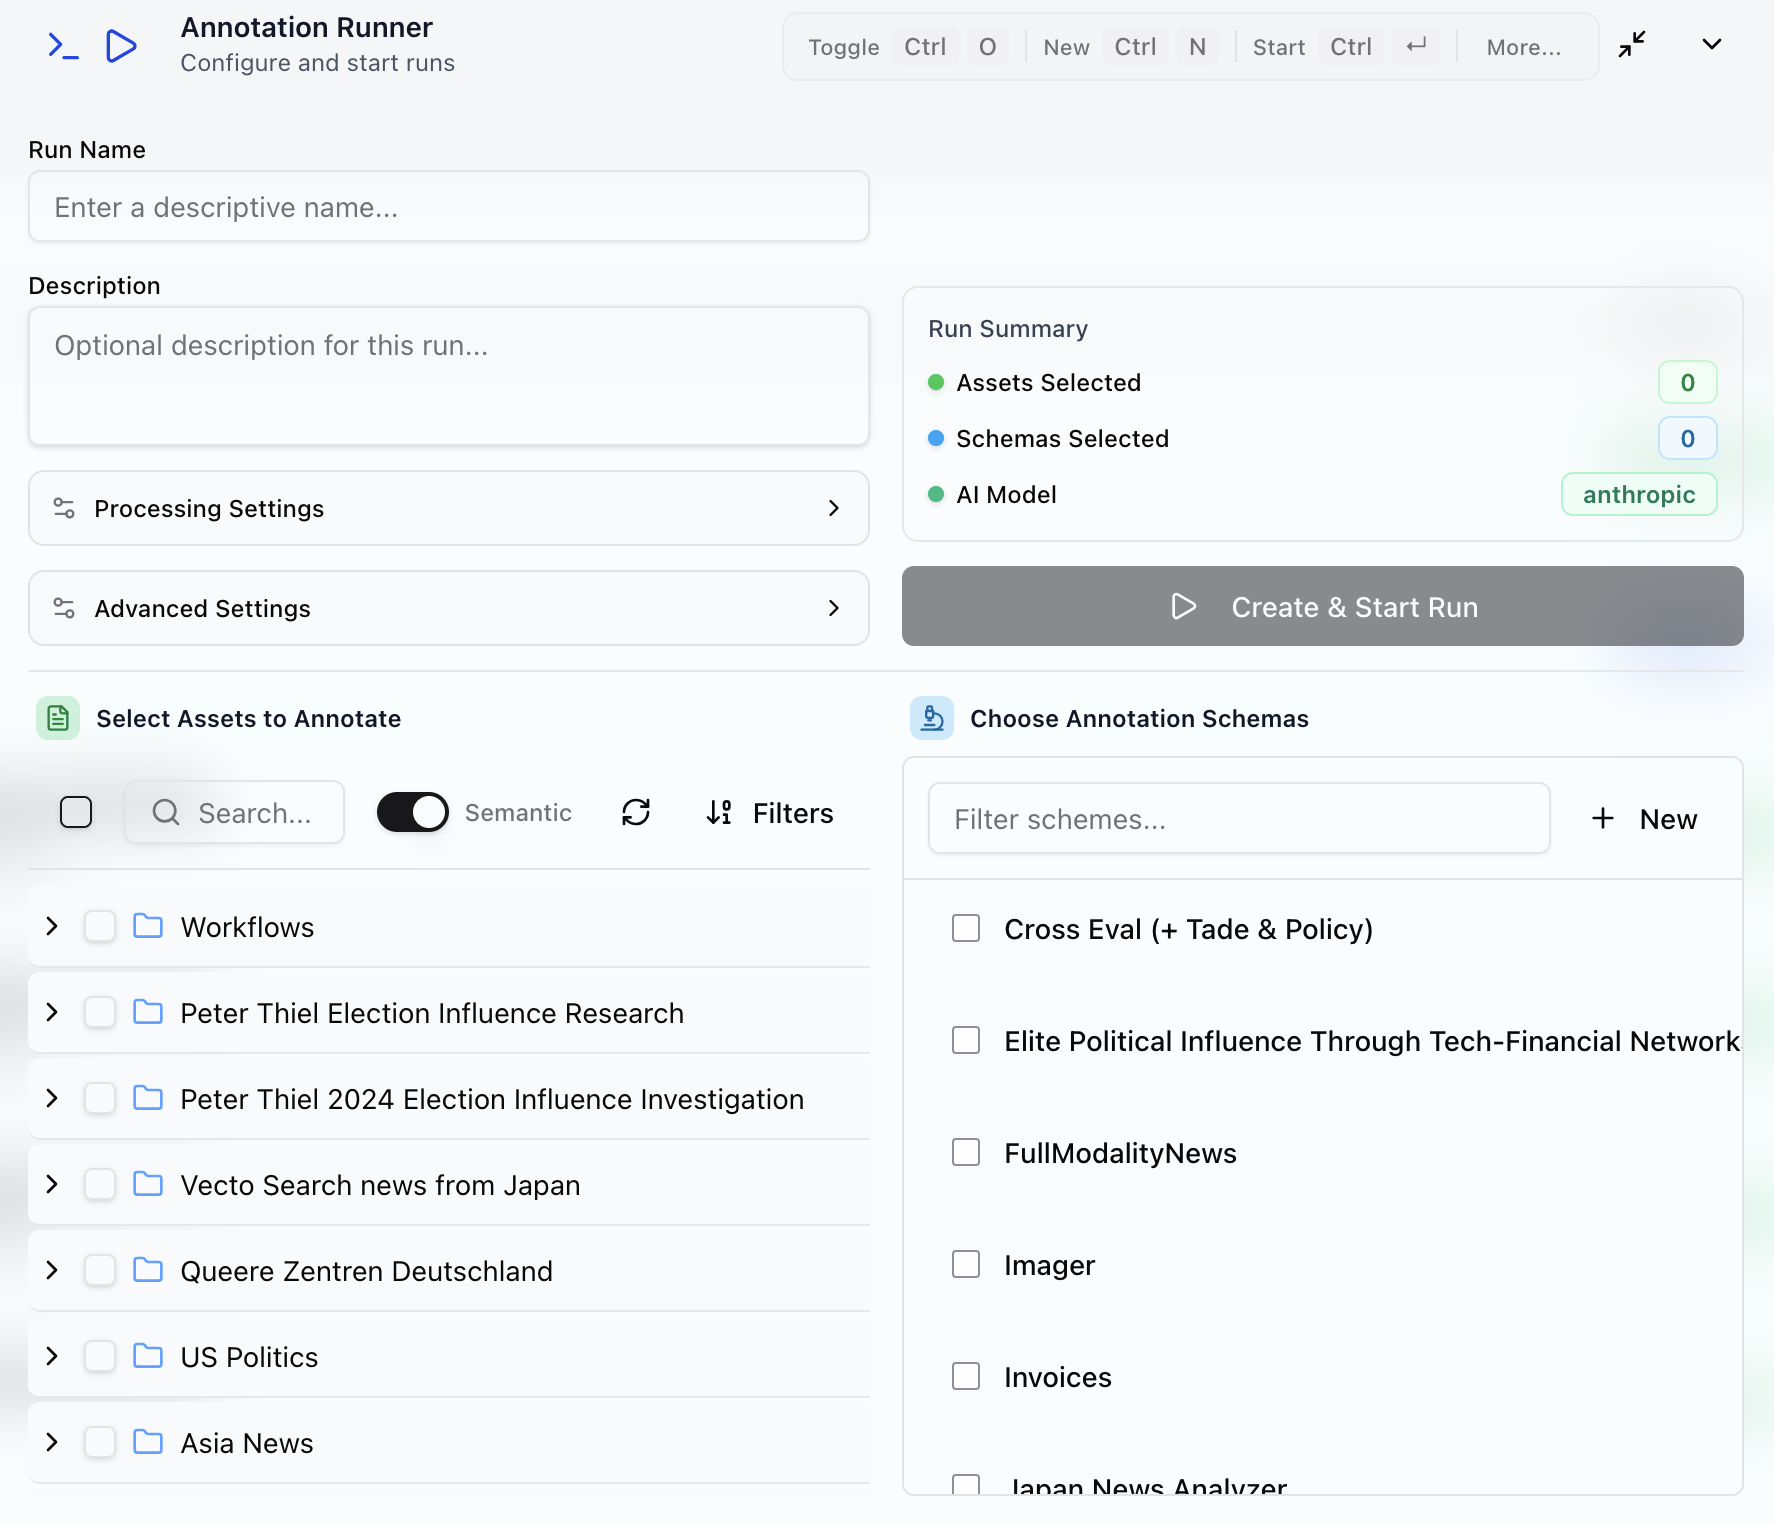
  <Card icon="cog" title="1. Configure an analysis run">
    What questions do you want to answer? What data do you have?
    Also set up parametrs like parallelisation and if you want justifications for fields.

    <img className="hidden dark:block" src="https://mintcdn.com/openpolitics/ROUsCWRLaAxCeMdD/images/run-config-dark.png?fit=max&auto=format&n=ROUsCWRLaAxCeMdD&q=85&s=573420decb1ac309c567dc04c02d05d8" alt="Configure an analysis" width="100%" data-path="images/run-config-dark.png" />

    <img className="block dark:hidden" src="https://mintcdn.com/openpolitics/ROUsCWRLaAxCeMdD/images/run-config-light.png?fit=max&auto=format&n=ROUsCWRLaAxCeMdD&q=85&s=232b1d1478cbcecae9b6987ff5c04e17" alt="Configure an analysis" width="100%" data-path="images/run-config-light.png" />

    [More information on creating an analysis](/pages/concepts/running-analysis)
  </Card>

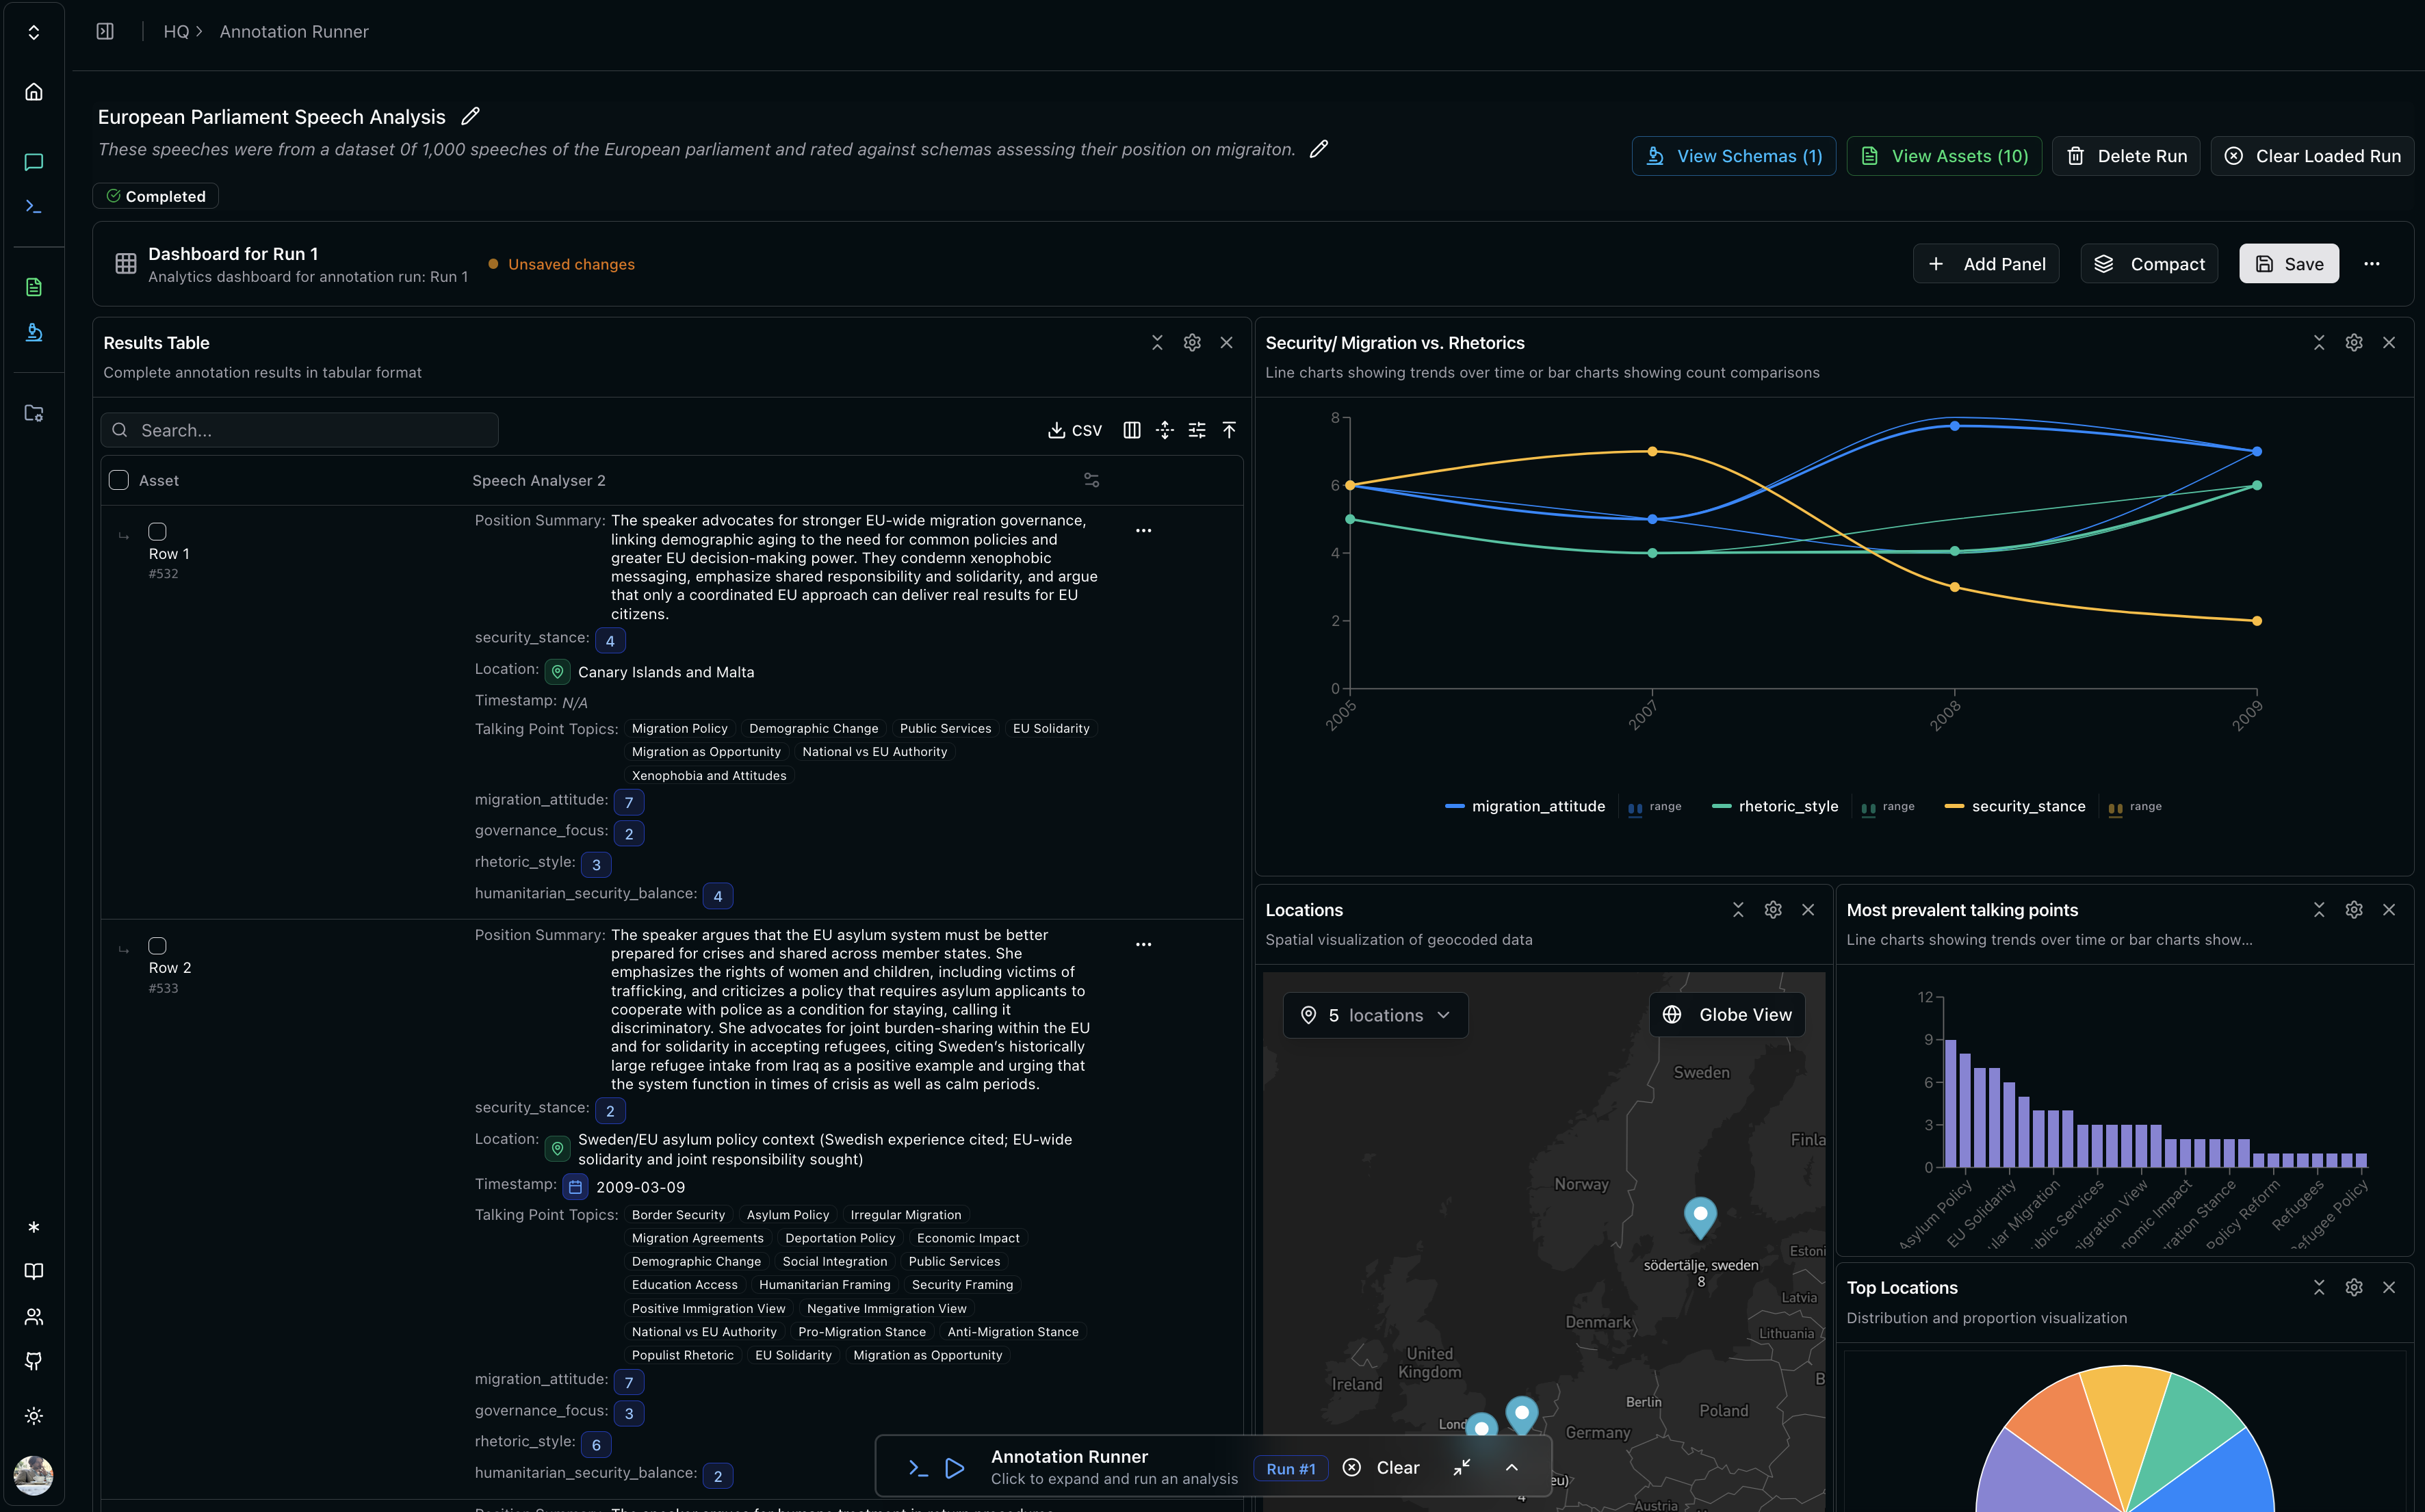
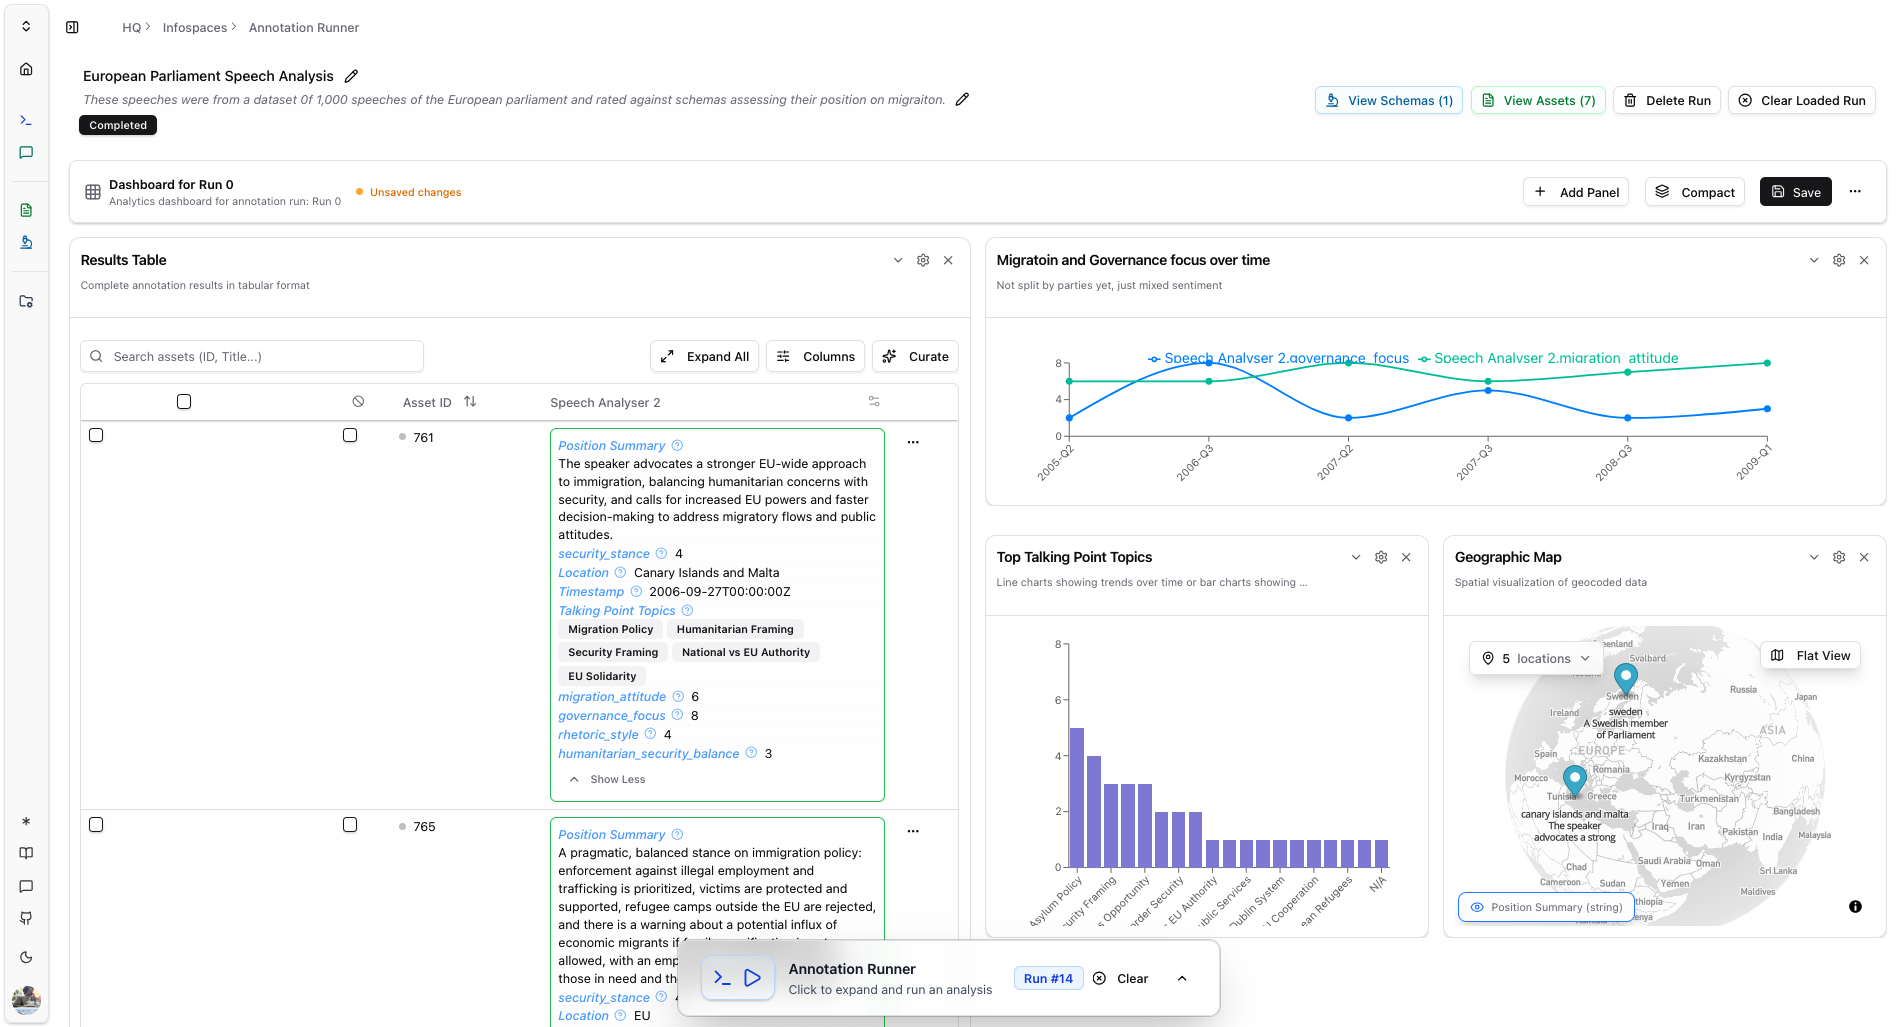
  <Card icon="chart-line" title="2. Explore, Share and Work with the run's Dashboard">
    Your results. Tables, charts, maps. Export or share.
    Every run produces structured data. Or as we call them: <span className="font-bold">annotations</span>. Filter, visualise and drill down into your findings.

    <img className="hidden dark:block" src="https://mintcdn.com/openpolitics/ROUsCWRLaAxCeMdD/images/dashboard-speeches-dark.png?fit=max&auto=format&n=ROUsCWRLaAxCeMdD&q=85&s=9da1306e429ea566c96a8c74ea973209" alt="Dashboard" width="100%" data-path="images/dashboard-speeches-dark.png" />

    <img className="block dark:hidden" src="https://mintcdn.com/openpolitics/ROUsCWRLaAxCeMdD/images/dashboard-speeches-light.png?fit=max&auto=format&n=ROUsCWRLaAxCeMdD&q=85&s=a0ce330182bffc9804be33191eef5b77" alt="Dashboard" width="100%" data-path="images/dashboard-speeches-light.png" />

    [More information on dashboards](/pages/app/dashboards)
  </Card>
</CardGroup>

## Chat & Tools

<Card title="Chat" icon="comments" href="/pages/app/chat">
  Your data management interface. Query, build schemas, run analysis, explore, find similar items. Deduplicate and synthesise - through dialogue.

  <video controls width="100%">
    <source src="https://mintcdn.com/openpolitics/sQ8DyD30OddnGDSH/images/chat-demo.mp4?fit=max&auto=format&n=sQ8DyD30OddnGDSH&q=85&s=0a8c665a6af5183636d180d5348ea572" type="video/mp4" data-path="images/chat-demo.mp4" />
  </video>

  \| [More information on chat](/pages/app/chat) | [Advanced Chatting](/pages/concepts/advanced-chatting) |

  <CardGroup cols={1}>
    ```mermaid theme={null}
    flowchart TB
        C[Chat] --> A[Assets]
        C[Chat] --> S[Schemas]
        C[Chat] --> D[Dashboards]
        C[Chat] --> W[Websearch]
        C[Chat] --> V[Vector search]
    ```
  </CardGroup>
</Card>

## Want to know what do with the results?