> ## Documentation Index
> Fetch the complete documentation index at: https://docs.open-politics.org/llms.txt
> Use this file to discover all available pages before exploring further.
# Schemas
> Tell the AI what to extract from your documents
A schema is a set of instructions for extracting structured data from documents. You describe what you want in plain English, the AI applies it consistently across hundreds or thousands of items.
Schemas bridge natural language and structured data. You express your framework in plain English, and get back consistent, well-defined results ready for analysis, data management and export.
## What You Get
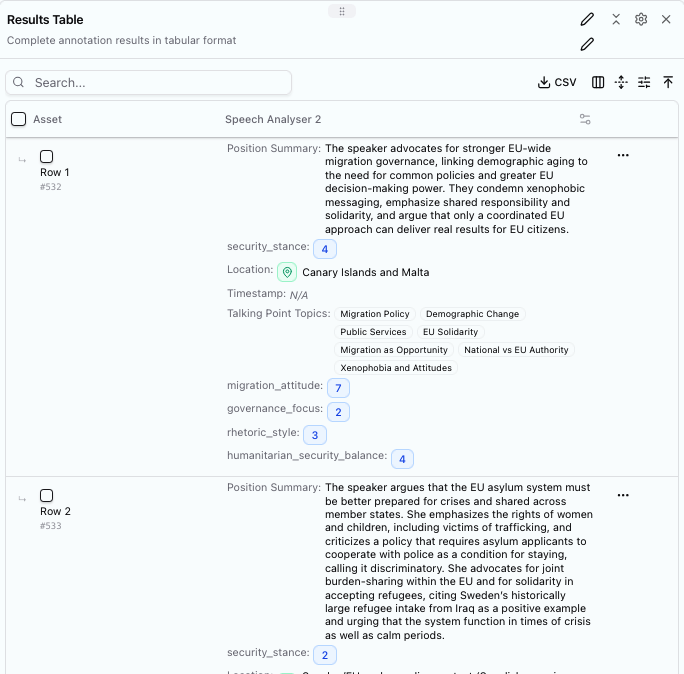
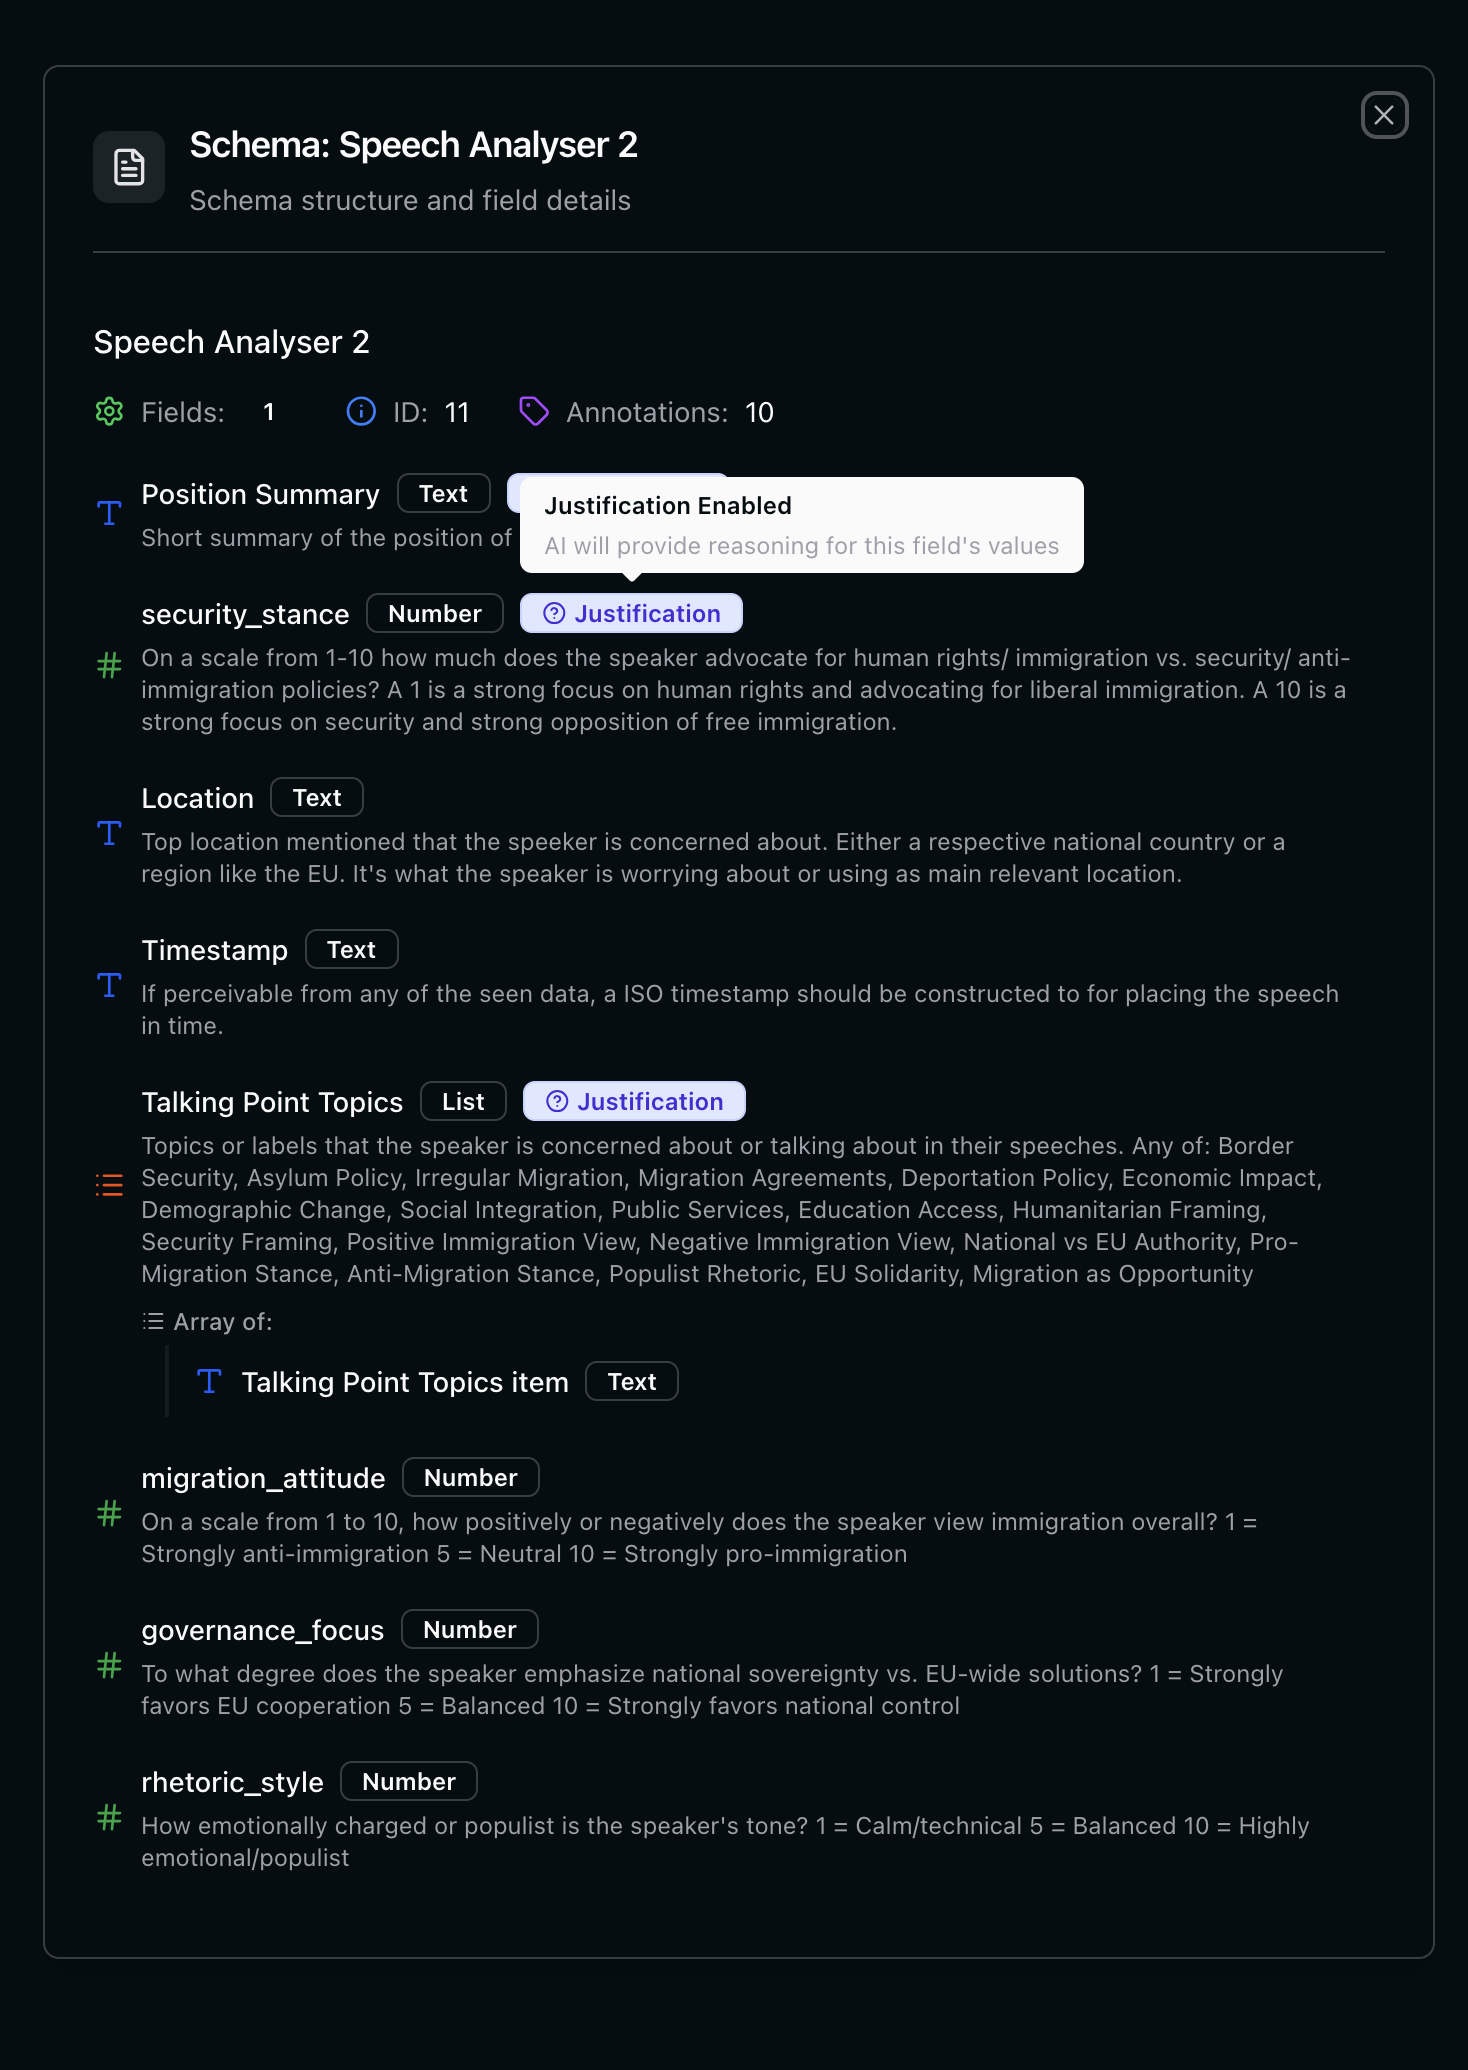
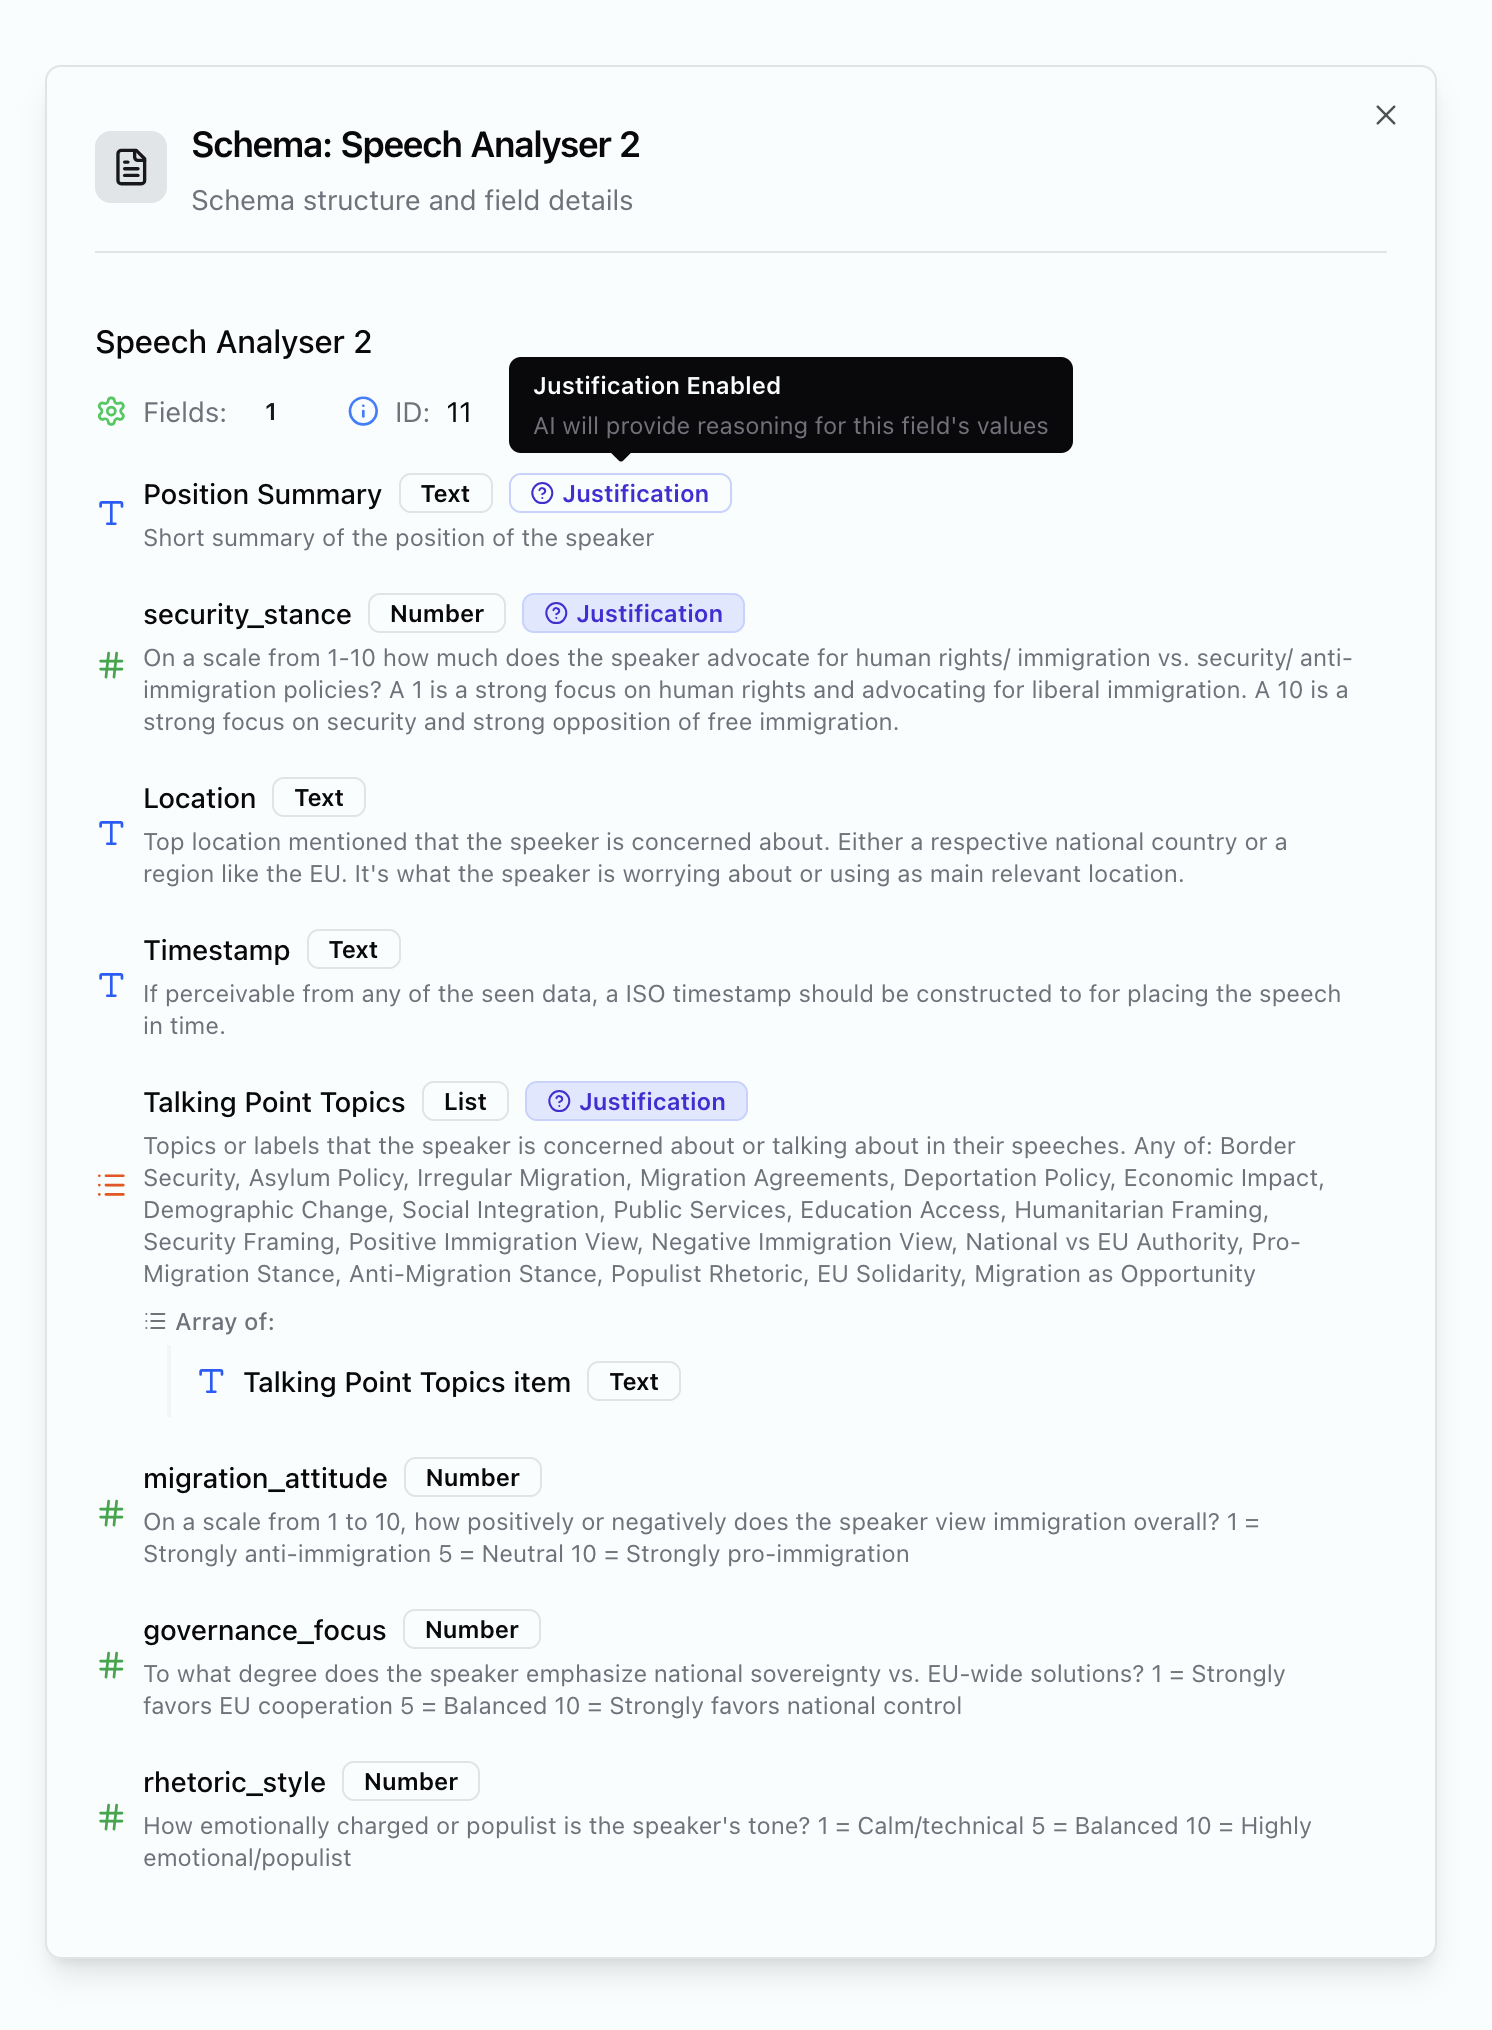
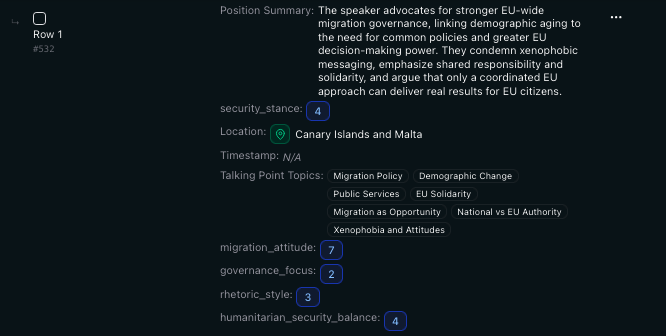 Each speech gets analysed for the same fields: position summary, security stance (1-10), location mentions, talking point topics, migration attitude, governance focus, rhetoric style. The schema defines what to extract - the AI does the extraction.
With structured output, you can filter, compare, and visualise. Which speakers emphasise humanitarian concerns vs. security? How does rhetoric differ by country? That's the point.
Each speech gets analysed for the same fields: position summary, security stance (1-10), location mentions, talking point topics, migration attitude, governance focus, rhetoric style. The schema defines what to extract - the AI does the extraction.
With structured output, you can filter, compare, and visualise. Which speakers emphasise humanitarian concerns vs. security? How does rhetoric differ by country? That's the point.
 ## Building a Schema
Start with your actual questions. What do you want to know about your documents?
* What positions are being taken?
* How is the issue framed?
* Who's mentioned, and in what context?
* What's the emotional temperature?
Then turn each question into an extraction field.
### Good Instructions vs. Vague Instructions
The difference between useful output and noise is specificity.
**Type:** Number (1-10)\
**Extract:** Position on border security. 1 = open borders, 10 = strict enforcement
**Type:** List\
**Extract:** Main topics discussed - migration policy, demographic change, EU solidarity, public services, etc.
*Clear scales, concrete categories, examples of valid values.*
**Type:** Text\
**Extract:** What is their position on the issue?
*Too vague. Which issue? What aspects of their position? The AI will guess, and guesses vary.*
### Field Types
| Type | Use for | Example |
| ---------- | --------------------------------------------- | ---------------------------------------- |
| **String** | Freeform text, summaries, answers, categories | `summary: "Speaker argues for..."` |
| **Number** | Ratings, scales, counts, amounts | `security_stance: 7` |
| **List** | Multiple values, tags, topics | `topics: ["migration", "EU solidarity"]` |
**Binary fields for filtering:** It's often useful to include 0/1 or yes/no fields for filtering results. Something like `is_spam: 0` or `is_relevant: 1` lets you quickly filter out noise in dashboards.
### Special Field Names
Certain field names unlock specific features when you view results:
| Field name | What it enables | How to prompt |
| ----------- | -------------------------------------------------------------------------- | ----------------------------------------------------------------------- |
| `location` | Geographic maps - locations get geocoded and plotted | Ask for single most relevant location or region relevant |
| `timestamp` | Time series charts - combine with number fields to track changes over time | Ask for a ISO timestamp of the article's main event or publication date |
| `summary` | Highlighted in result views as the main description | Ask for a summary with your preferred style and length |
| `tags` | Counted and aggregated across results | Either freeform or just from a few given tags |
It is always good to provide a fallback choice like "None" or "Unapplicable".
Other list fields also get counted automatically. If you extract `talking_point_topics` as a list, you'll see frequency distributions in dashboards.
Numbers with defined scales (1-10, 1-5) work well for comparative analysis - they enable meaningful aggregation and time series when combined with timestamps.
***
## Tips
**Include examples in your instructions.** "Source type: government, activist, expert, journalist, or anonymous" gives the AI a bounded set to work with.
**Use scales for subjective measures.** "Emotional intensity (1-10)" is more useful than "how emotional is it?" because you can aggregate and compare.
**Start simple, then add.** Begin with basic extraction (who, what, where), confirm it works, then layer in analysis fields (sentiment, framing, stance).
**Look at failures.** When extraction is wrong or inconsistent, the instructions usually need tightening. What did the AI misunderstand?
***
## Sharing Schemas
Schemas can be uploaded to the library for others to use. They can see your methodology, critique it, replicate it, build on it. Transparency about how analysis is done matters - it's what separates systematic research from vibes.
***
## Related pages
Apply schemas to your documents
Promote extractions to persistent metadata
Upload and organise documents for analysis
Visualise results with charts and tables
## Building a Schema
Start with your actual questions. What do you want to know about your documents?
* What positions are being taken?
* How is the issue framed?
* Who's mentioned, and in what context?
* What's the emotional temperature?
Then turn each question into an extraction field.
### Good Instructions vs. Vague Instructions
The difference between useful output and noise is specificity.
**Type:** Number (1-10)\
**Extract:** Position on border security. 1 = open borders, 10 = strict enforcement
**Type:** List\
**Extract:** Main topics discussed - migration policy, demographic change, EU solidarity, public services, etc.
*Clear scales, concrete categories, examples of valid values.*
**Type:** Text\
**Extract:** What is their position on the issue?
*Too vague. Which issue? What aspects of their position? The AI will guess, and guesses vary.*
### Field Types
| Type | Use for | Example |
| ---------- | --------------------------------------------- | ---------------------------------------- |
| **String** | Freeform text, summaries, answers, categories | `summary: "Speaker argues for..."` |
| **Number** | Ratings, scales, counts, amounts | `security_stance: 7` |
| **List** | Multiple values, tags, topics | `topics: ["migration", "EU solidarity"]` |
**Binary fields for filtering:** It's often useful to include 0/1 or yes/no fields for filtering results. Something like `is_spam: 0` or `is_relevant: 1` lets you quickly filter out noise in dashboards.
### Special Field Names
Certain field names unlock specific features when you view results:
| Field name | What it enables | How to prompt |
| ----------- | -------------------------------------------------------------------------- | ----------------------------------------------------------------------- |
| `location` | Geographic maps - locations get geocoded and plotted | Ask for single most relevant location or region relevant |
| `timestamp` | Time series charts - combine with number fields to track changes over time | Ask for a ISO timestamp of the article's main event or publication date |
| `summary` | Highlighted in result views as the main description | Ask for a summary with your preferred style and length |
| `tags` | Counted and aggregated across results | Either freeform or just from a few given tags |
It is always good to provide a fallback choice like "None" or "Unapplicable".
Other list fields also get counted automatically. If you extract `talking_point_topics` as a list, you'll see frequency distributions in dashboards.
Numbers with defined scales (1-10, 1-5) work well for comparative analysis - they enable meaningful aggregation and time series when combined with timestamps.
***
## Tips
**Include examples in your instructions.** "Source type: government, activist, expert, journalist, or anonymous" gives the AI a bounded set to work with.
**Use scales for subjective measures.** "Emotional intensity (1-10)" is more useful than "how emotional is it?" because you can aggregate and compare.
**Start simple, then add.** Begin with basic extraction (who, what, where), confirm it works, then layer in analysis fields (sentiment, framing, stance).
**Look at failures.** When extraction is wrong or inconsistent, the instructions usually need tightening. What did the AI misunderstand?
***
## Sharing Schemas
Schemas can be uploaded to the library for others to use. They can see your methodology, critique it, replicate it, build on it. Transparency about how analysis is done matters - it's what separates systematic research from vibes.
***
## Related pages
Apply schemas to your documents
Promote extractions to persistent metadata
Upload and organise documents for analysis
Visualise results with charts and tables