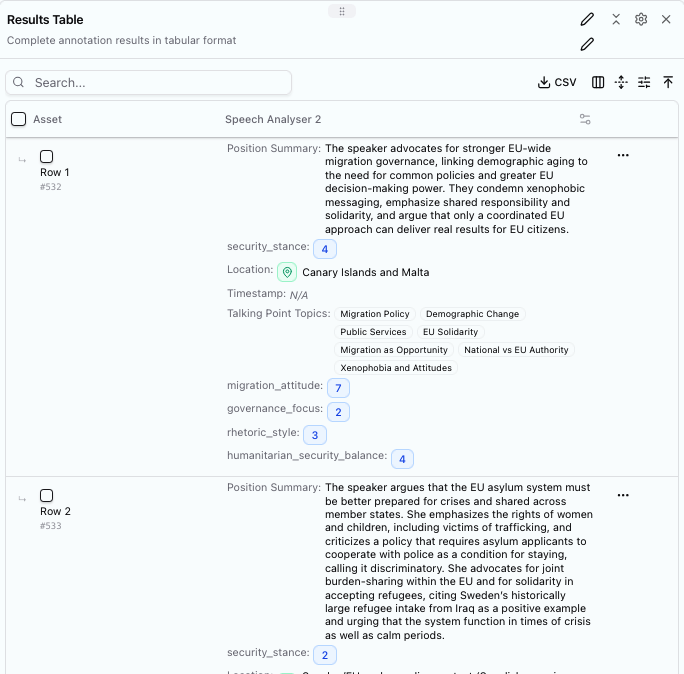
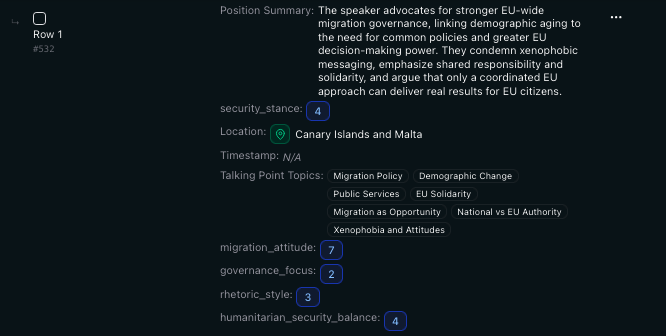
What You Get
Output from a schema analysing EU Parliament speeches on migration
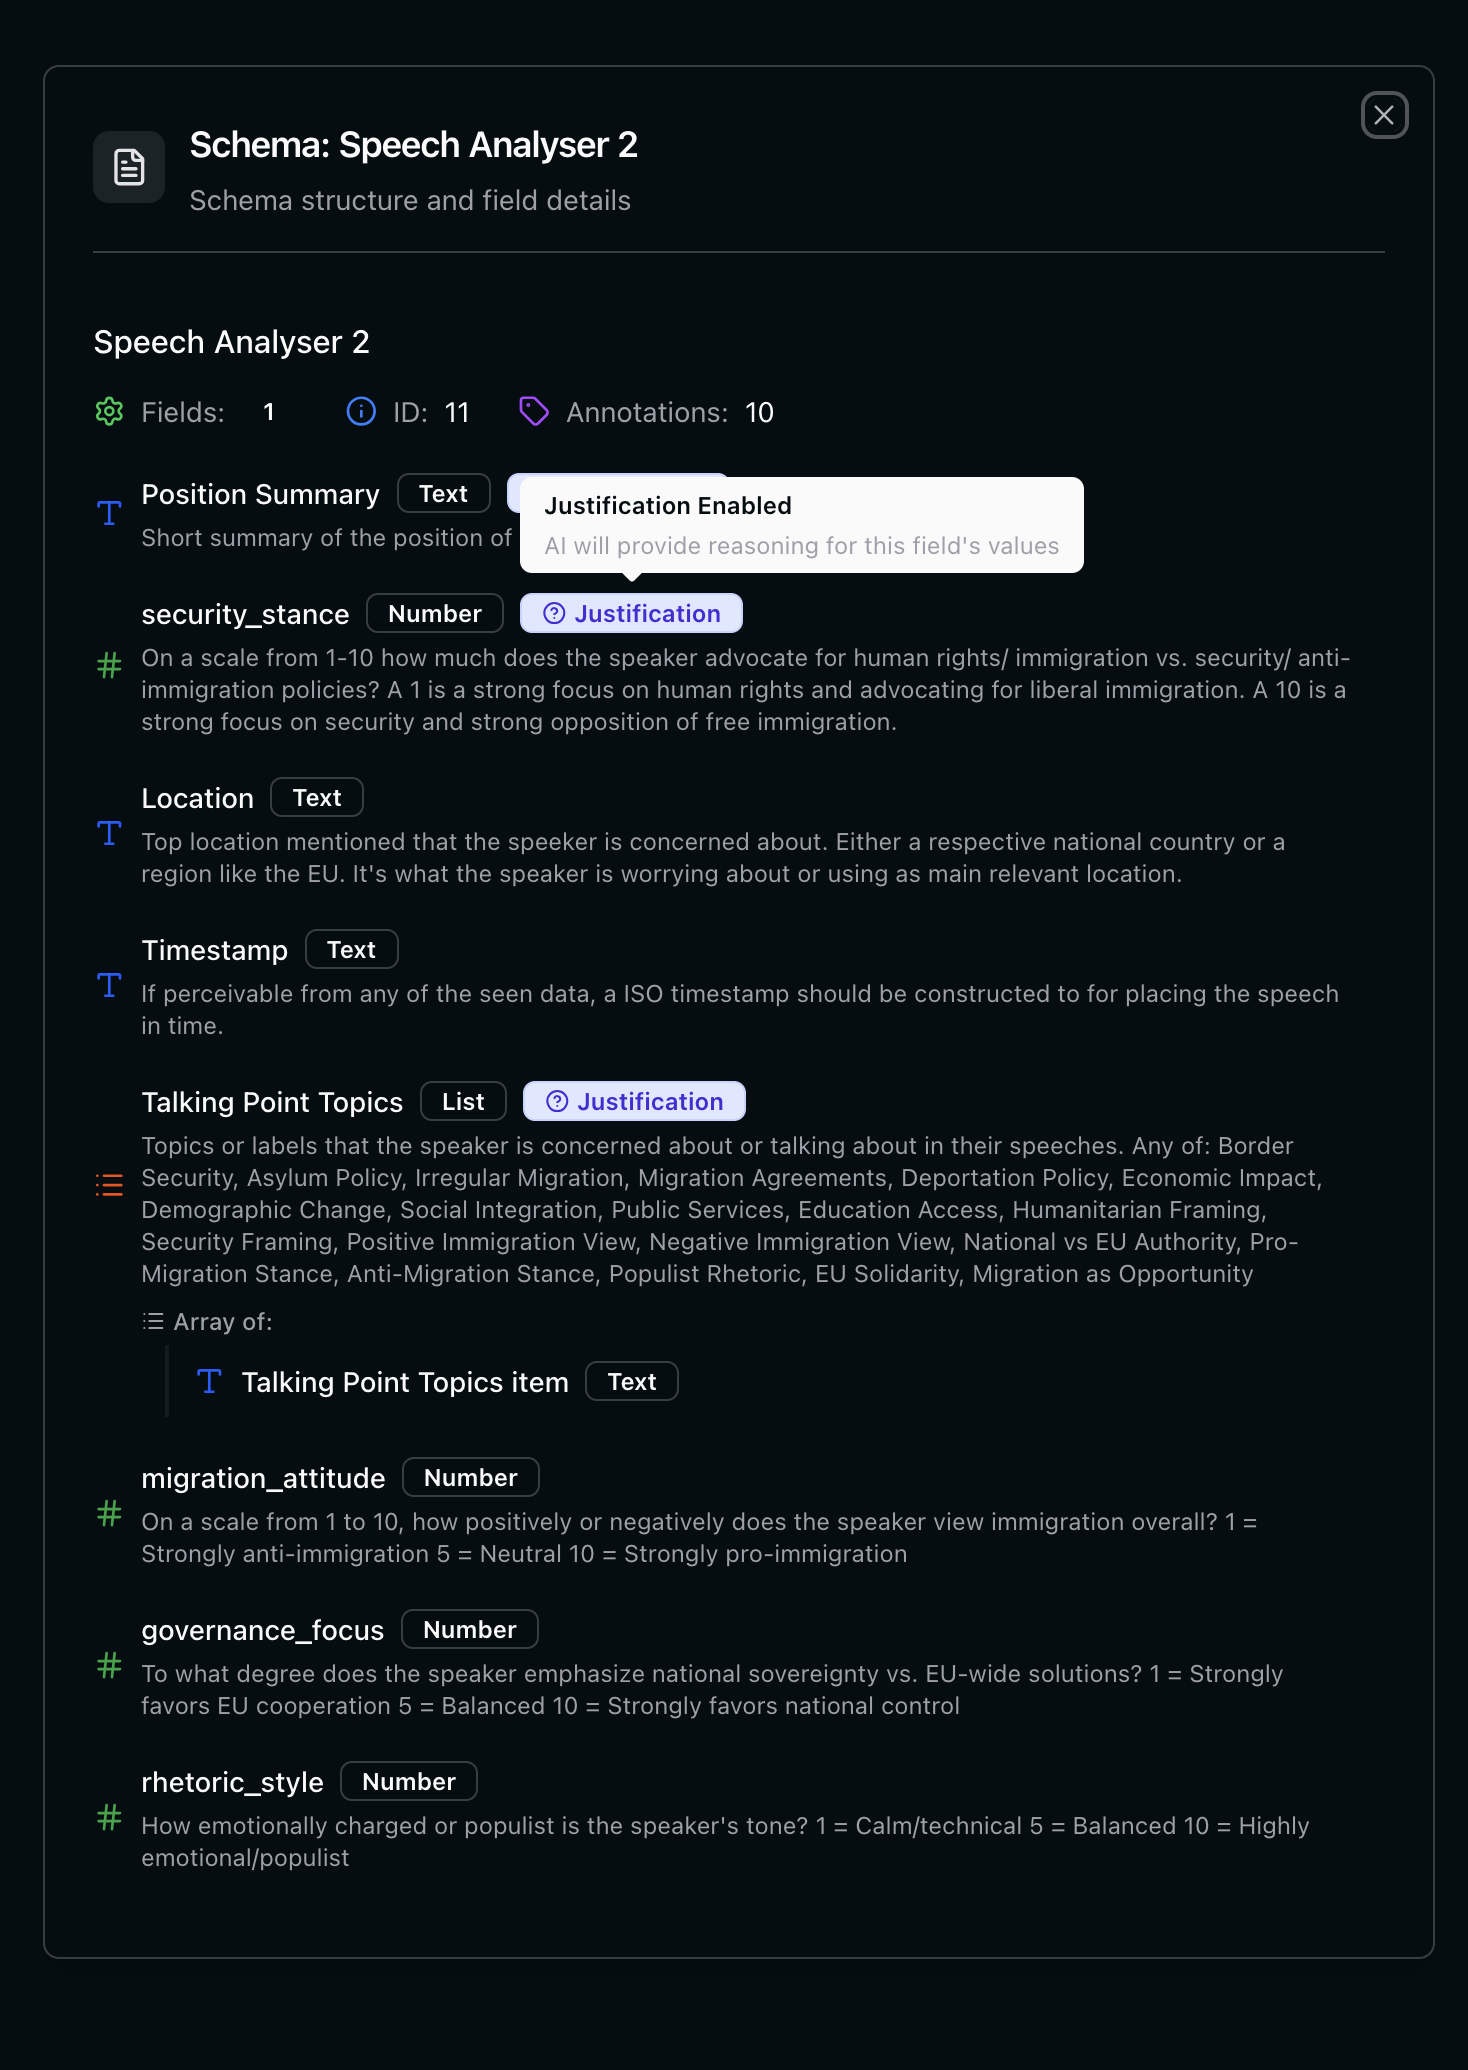
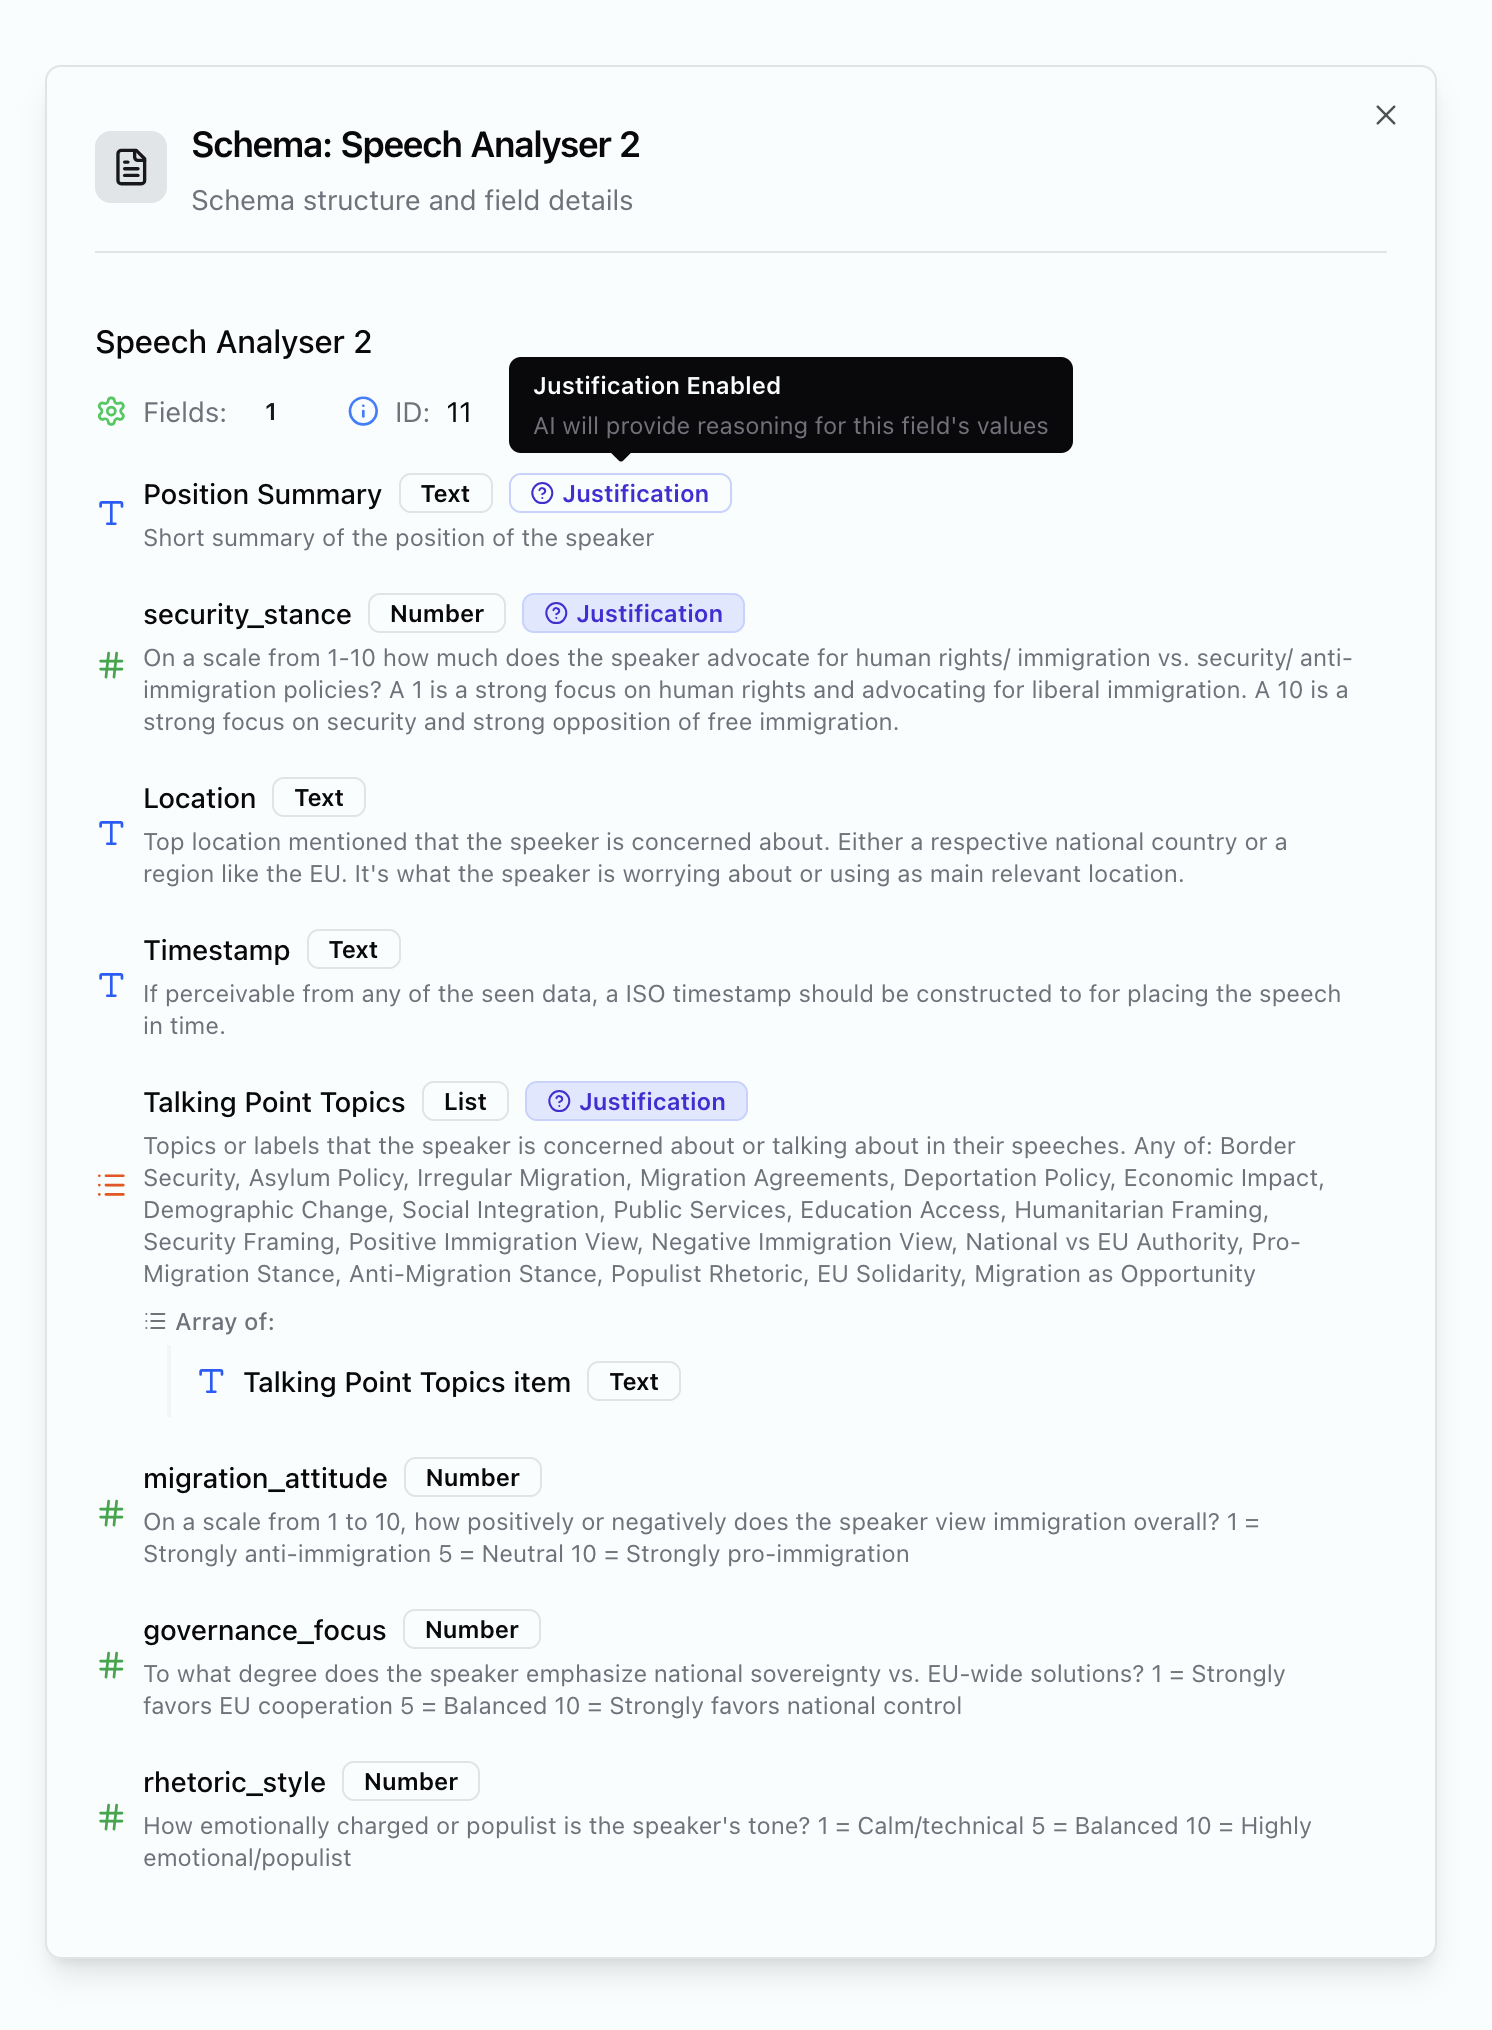
The schema that was used to extract the data
Building a Schema
Start with your actual questions. What do you want to know about your documents?- What positions are being taken?
- How is the issue framed?
- Who’s mentioned, and in what context?
- What’s the emotional temperature?
Good Instructions vs. Vague Instructions
The difference between useful output and noise is specificity.- ✓ This works
- ✗ This doesn't
security_stance
Type: Number (1-10)
Extract: Position on border security. 1 = open borders, 10 = strict enforcement
Extract: Position on border security. 1 = open borders, 10 = strict enforcement
talking_point_topics
Type: List
Extract: Main topics discussed - migration policy, demographic change, EU solidarity, public services, etc.
Extract: Main topics discussed - migration policy, demographic change, EU solidarity, public services, etc.
Field Types
Binary fields for filtering: It’s often useful to include 0/1 or yes/no fields for filtering results. Something like
is_spam: 0 or is_relevant: 1 lets you quickly filter out noise in dashboards.Special Field Names
Certain field names unlock specific features when you view results:It is always good to provide a fallback choice like “None” or “Unapplicable”.
talking_point_topics as a list, you’ll see frequency distributions in dashboards.
Numbers with defined scales (1-10, 1-5) work well for comparative analysis - they enable meaningful aggregation and time series when combined with timestamps.
Tips
Include examples in your instructions. “Source type: government, activist, expert, journalist, or anonymous” gives the AI a bounded set to work with. Use scales for subjective measures. “Emotional intensity (1-10)” is more useful than “how emotional is it?” because you can aggregate and compare. Start simple, then add. Begin with basic extraction (who, what, where), confirm it works, then layer in analysis fields (sentiment, framing, stance). Look at failures. When extraction is wrong or inconsistent, the instructions usually need tightening. What did the AI misunderstand?Sharing Schemas
Schemas can be uploaded to the library for others to use. They can see your methodology, critique it, replicate it, build on it. Transparency about how analysis is done matters - it’s what separates systematic research from vibes.Related pages
Running Analysis
Apply schemas to your documents
Curating Fragments
Promote extractions to persistent metadata
Assets & Bundles
Upload and organise documents for analysis
Dashboards
Visualise results with charts and tables